
Drought History by State, 2000–2026: Where It Stays and When It Spreads
Since 2000, drought in the United States has had a clear home: the Southwest. Arizona, New Mexico, Nevada and Utah averaged a Drought Severity and Coverage Index (DSCI) between 170 and 189 from 2000 through 2025. New York, Pennsylvania and Ohio averaged under 30. But drought also travels. In 2002, 2012, 2021 and 2022, at least a dozen states averaged a DSCI of 200 or more for the year, and 2026 has already pushed drought across the Southeast.
This page uses the U.S. Drought Monitor's weekly record for every state, 4 January 2000 to 6 October 2026, to show where drought tends to stay, when it spreads, and how to read your own state's row.
What the index measures
The Drought Monitor map sorts land into five categories, from D0 (abnormally dry) to D4 (exceptional drought). The DSCI turns a week's map into one number per state: the percentage of the state in D0, plus twice the percentage in D1, three times D2, four times D3 and five times D4 (National Drought Mitigation Center, DSCI). It runs from 0, when no part of the state is even abnormally dry, to 500, when the whole state is in exceptional drought.
A DSCI of 200 can mean all of a state in moderate drought (D1), or about half of it in severe-to-extreme drought with the rest normal. It measures how much of the state is in drought and how bad that drought is, together. The Drought Monitor itself blends rainfall, soil moisture, streamflow and other indicators with expert judgement; the DSCI is a summary of that map, not a rain gauge reading. The NDMC describes it as experimental and says best practices for using it over time are still evolving.
Every state, every month since 2000
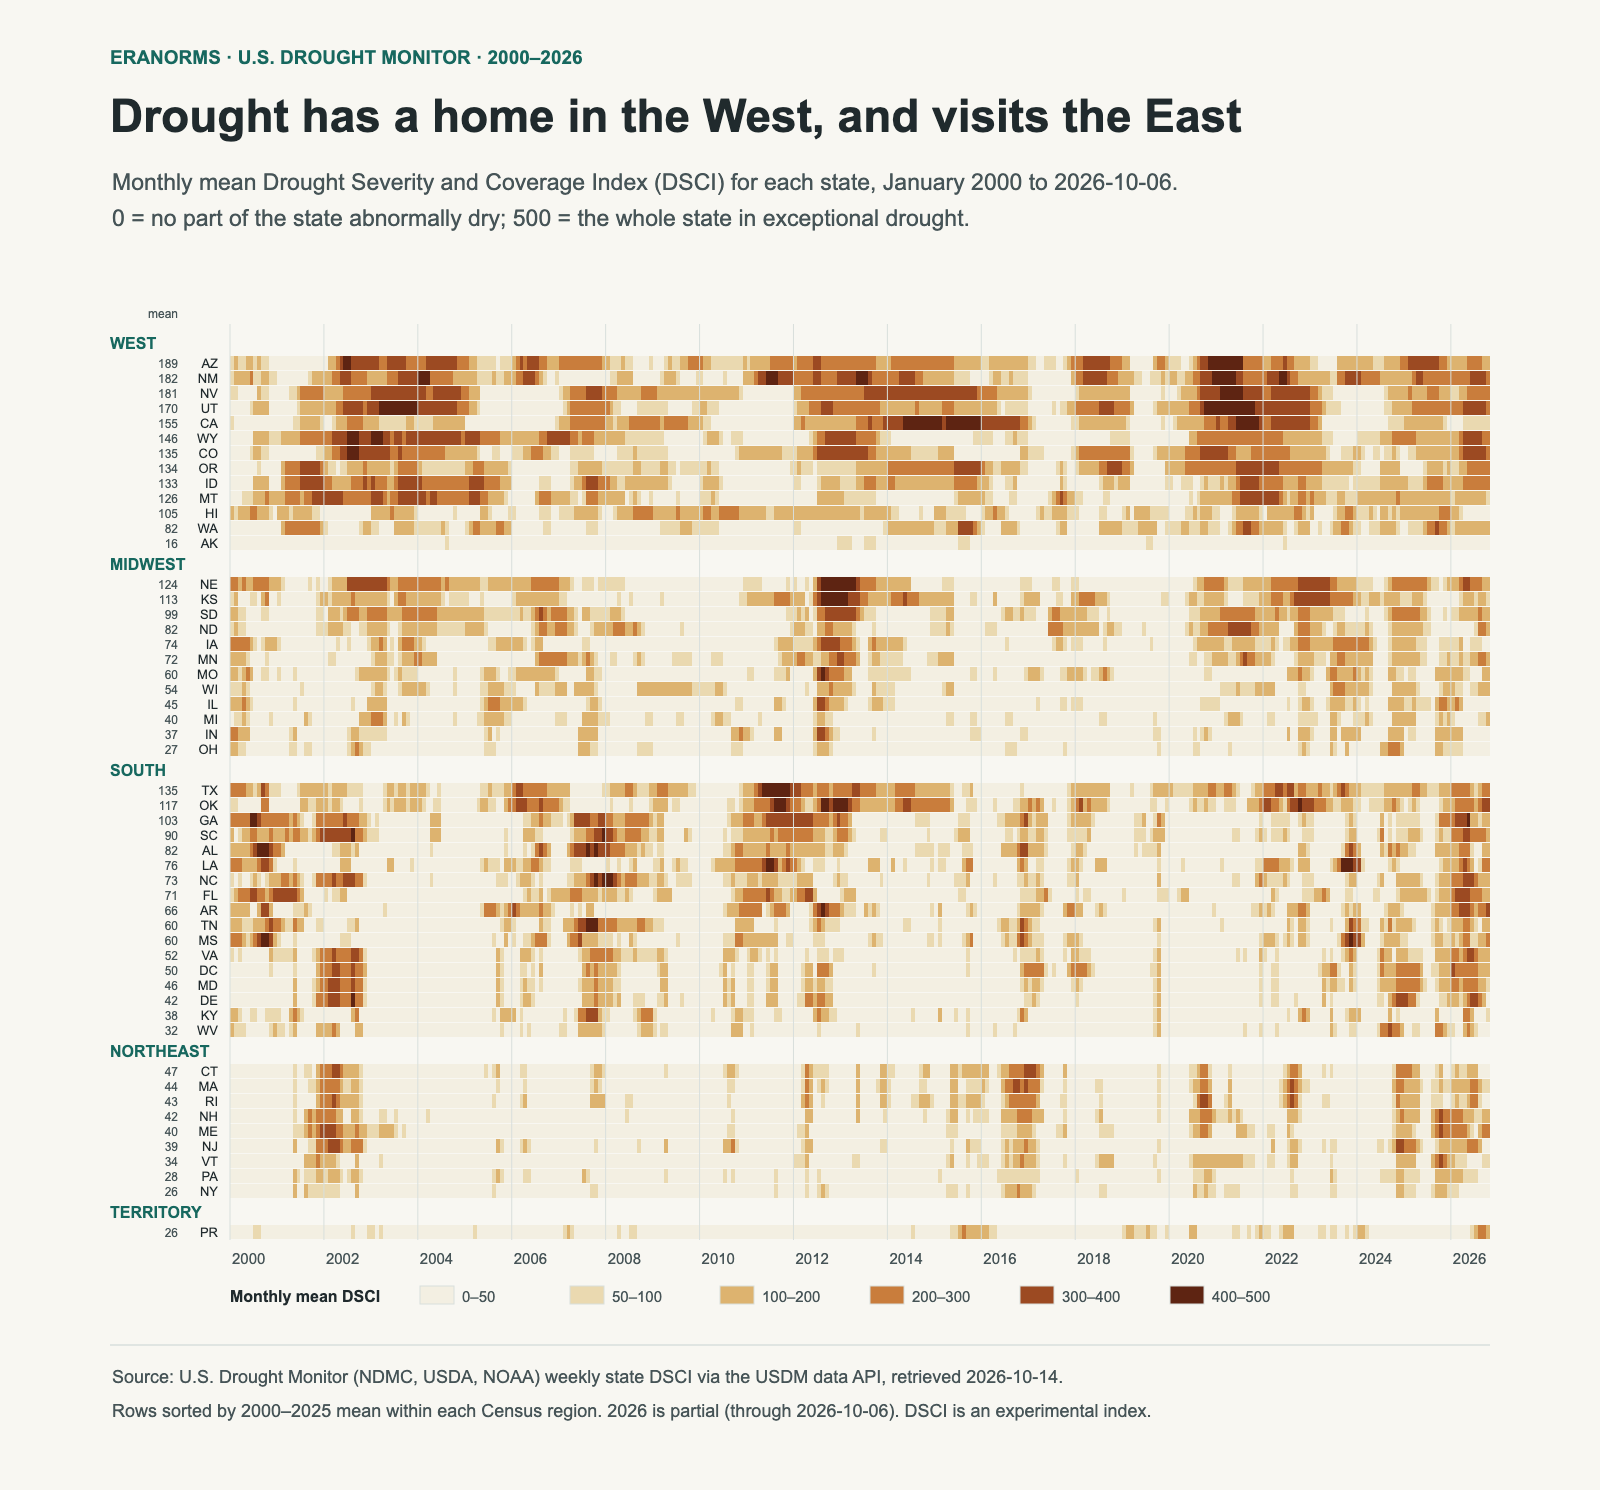
Read the West block first. Arizona, New Mexico, Nevada and Utah are dark for long stretches, sometimes for years: 2002–04, 2012–14 and 2020–22. Drought there is often a multi-year state, not a passing event. California's row shows the 2012–16 drought as one long band, with a yearly average above 400 in both 2014 and 2015.
Now look at the Northeast. Its rows are mostly pale, broken by short, sharp episodes: 2002, 2016, 2020 and the last two years. Massachusetts reached 340 in September 2016, a serious drought, but it had eased by spring 2017. A low long-run average doesn't mean a state never gets drought. It means drought there usually comes and goes faster.
| State | Average DSCI | Weeks at 300 or more | Highest week |
|---|---|---|---|
| Arizona | 189 | 18% | 468 (1 December 2020) |
| New Mexico | 183 | 22% | 440 (14 June 2022) |
| Nevada | 181 | 25% | 414 (13 July 2021) |
| Utah | 170 | 22% | 470 (20 July 2021) |
| California | 155 | 18% | 440 (29 July 2014) |
| Ohio | 27 | 0% | 298 (24 September 2024) |
| New York | 26 | 0% | 229 (18 October 2016) |
| Alaska | 16 | 0% | 101 (23 July 2019) |
The "weeks at 300 or more" column counts the whole record through October 2026. Texas has the single highest week of any state, 484 on 13 September 2011, during a year that averaged 383. Its long-run average of 135 is lower than the Southwest's because Texas swings between deep drought and long wet spells.
When drought spreads
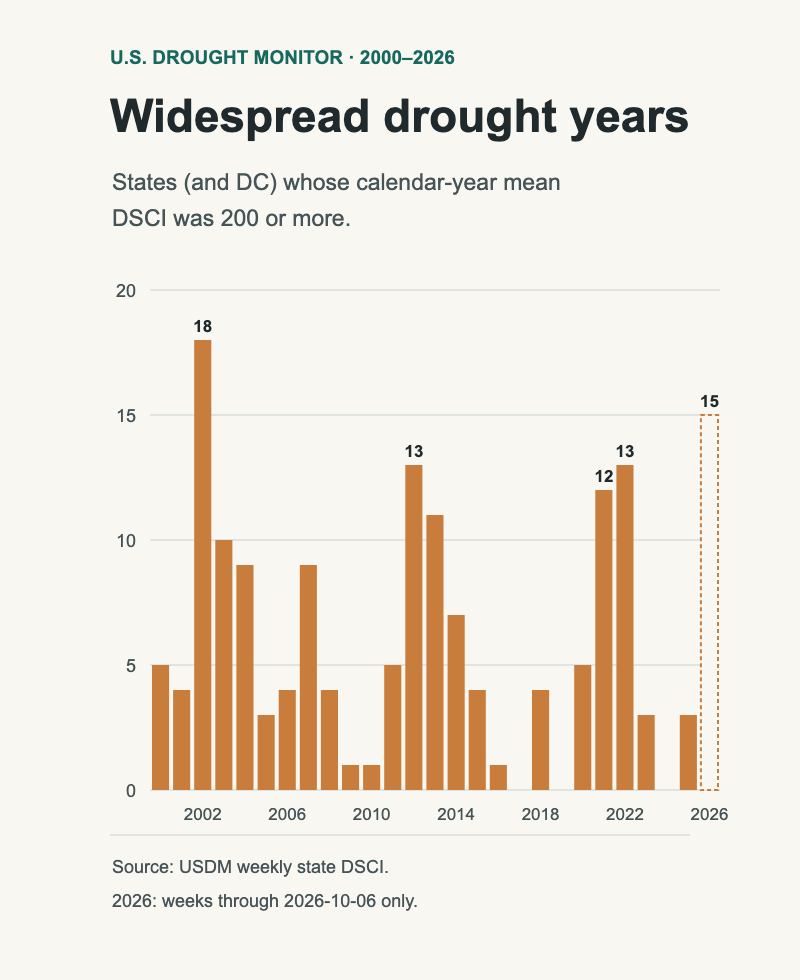
Most years, only a handful of states average 200 or more. Three periods stand out:
- 2002: 18 states, from the Mountain West to the mid-Atlantic and Maine: the widest spread of any complete year in this record.
- 2012–13: the Plains and Midwest. Nebraska shows how fast it arrived: its DSCI was 35 in mid-May 2012 and 414 by mid-August, about thirteen weeks later. In the heatmap that's the sudden dark block in the Midwest rows.
- 2021–22: the interior West, Pacific Northwest and northern Plains, with Utah's 470 in July 2021 among the highest weeks in the record.
2026 is different. Its 15 so far (14 states and DC) lean south and east: Florida, the Carolinas, Georgia, Arkansas, Virginia, Maryland and DC alongside Colorado, Utah and Wyoming. In the week of 28 April 2026, 14 states and DC were at 300 or more at once, the most of any week since 2000. Several Southeastern states have eased since; Georgia was at 120 on 6 October. A partial year can still change, so treat 2026 as a strong spring and summer, not a finished ranking.
Reading your own state
- Find your row and its average. The number beside the state code is its 2000–2025 average. Compare a current reading with that, not with another state's.
- Look for bands, not specks. A long dark band is a multi-year drought; scattered dark months are short episodes. They call for different planning.
- Remember it's statewide. A state average can hide a county in exceptional drought or a wet corner. Small states and DC reach 0 or 500 more easily, because one weather pattern can cover all of them. For local conditions, check the current Drought Monitor map.
- Don't read it as rainfall. A wet month can leave a high DSCI if soil and reservoirs are still depleted. For what rain itself looks like through the year, see average rainfall by month.
Method and limits
Weekly state DSCI values come from the Drought Monitor's data service, retrieved 14 October 2026: 1,397 weeks for each of the 50 states, DC and Puerto Rico. Monthly values are plain averages of that month's weekly maps; state averages use complete years, 2000–2025. Census regions group the rows, and DC sits in the South. This page describes the record. It doesn't adjust for changes in how the map has been drawn since 2000, and it makes no claim about causes or future drought.
The U.S. Drought Monitor is jointly produced by the National Drought Mitigation Center at the University of Nebraska–Lincoln, the U.S. Department of Agriculture and the National Oceanic and Atmospheric Administration. In the Eranorms app, a weather station's analysis dashboard includes this weekly DSCI line for the station's state, so you can see statewide drought next to that station's own record.