
How Does High Altitude Affect Sprinting vs. Distance Running? (Lessons From the 1968 Mexico City Olympics)
When the International Olympic Committee awarded the 1968 Summer Olympics to Mexico City—situated on a high volcanic plateau at 2,240 meters (7,350 feet) above sea level—sports physiologists predicted a dramatic split across the track and field program. What unfolded inside Estadio Olímpico Universitario in October 1968 remains the most famous natural experiment in human biomechanics: as documented in Wikipedia's historical record of athletics at the 1968 Summer Olympics, every single men's sprint, relay, and horizontal jumping event from 100 meters to 400 meters set a new world record—headlined by Bob Beamon's astonishing 8.90-meter (29 ft 2.5 in) long jump—while the men's 5,000 meters, 10,000 meters, and marathon produced the slowest Olympic winning times in nearly two decades.
Why does thin mountain air act like a legal tailwind for sprinters and jumpers while acting like a physiological anchor for distance runners, where is the exact duration crossover point (~60 to 120 seconds) where altitude switches from a net benefit to a net penalty, and why does World Athletics still mark records set above 1,000 meters with an "A"? Here is the complete physics and physiology breakdown—and how to benchmark your own age- and elevation-graded performance in Eranorms.
The Physics of Thin Air at 2,240 Meters: 22% Less Aerodynamic Drag
At sea level (0 meters), standard barometric pressure is 760 mmHg (101.3 kPa) and dry air density ($
ho$) at 20°C is roughly 1.20 to 1.225 kg/m³. At Mexico City's elevation of 2,240 meters (7,350 feet), the column of atmosphere above the track is roughly 22% to 24% thinner (~580 mmHg, air density ~0.96 kg/m³).
For an explosive sprinter or horizontal jumper moving at 10 to 11 meters per second (22 to 25 mph), aerodynamic drag force is proportional to air density and the square of velocity:
F_drag = 0.5 * rho * v^2 * C_d * A
Cutting air density ($ ho$) by 22% directly removes 22% of the air resistance pushing against a sprinter's chest and limbs:
- 100m & 200m Sprints: Biomechanical models show that
2,240 mof altitude is worth roughly0.06 to 0.08 secondsin the 100-meter dash (equivalent to an extra+1.2 m/stailwind) and0.14 to 0.18 secondsin the 200-meter dash. In Mexico City, Jim Hines ran9.95 seconds(the first official sub-10-second electronic 100m world record) and Tommie Smith ran19.83 seconds(the first sub-20-second 200m). - 400m Dash: Because the 400-meter sprint (
~44 seconds) is still powered ~85%–90%by anaerobic ATP-PCr and glycolysis, reduced air drag outweighed the minor oxygen deficit: Lee Evans ran43.86 seconds, the first sub-44-second 400m in history, which stood for 20 years until 1988. - Bob Beamon's
8.90 mLong Jump (+55 cm/+6.59%Over the World Record): On October 18, 1968, aided by thin air on his 10.7 m/s approach sprint, reduced air drag in flight, and a maximum legal+2.0 m/stailwind, Bob Beamon leaped8.90 meters(29 ft 2.5 in)—improving the world record (8.35 m) by an unprecedented55 centimeters(21.65 inches) and jumping right past the optical measuring rail!
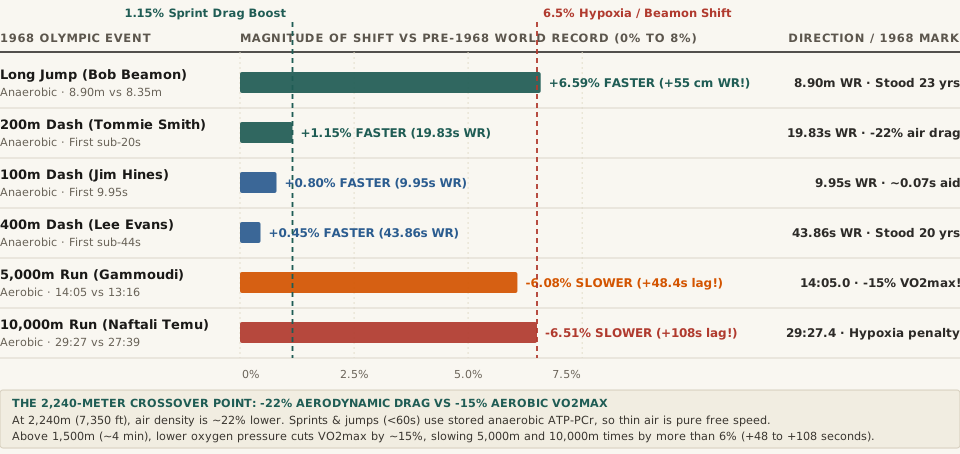
2,240 meters altitude) relative to pre-1968 world records across anaerobic sprints/jumps (green/blue, faster) versus aerobic distance races (orange/red, slower). Source: Wikipedia — Athletics at the 1968 Summer Olympics.The Physiology of Hypoxia Above 1,500 Meters: Why Distance Times Dropped 6%
Why did that same thin air devastate the 1,500m, 5,000m, 10,000m, and marathon? Because once a race lasts longer than 60 to 120 seconds (roughly the 800-meter mark), stored muscle phosphocreatine and anaerobic glycolysis can no longer sustain speed—the athlete depends on continuous aerobic oxygen transport (VO2max).
Although the percentage of oxygen in the air remains 20.9% at 2,240 meters, the 24% drop in barometric pressure reduces the partial pressure of inspired oxygen ($P_IO_2$) inside the lungs' alveoli, reducing arterial hemoglobin saturation and cutting an elite sea-level runner's VO2max by roughly 12% to 15% (~1% loss for every 100 meters of elevation above 700–1,000 meters):
- The 800m Neutral Crossover (
~1:44): In the men's 800 meters (~55%aerobic,~45%anaerobic), the aerodynamic drag savings and the hypoxia penalty canceled each other out almost perfectly, allowing Ralph Doubell to equal Peter Snell's world record of1:44.3. - The 5,000m and 10,000m Slowdown (
-6.1%to-6.5%): At slower distance-running speeds (5.5 to 6.0 m/s), aerodynamic drag is tiny, while a 15% loss inVO2maxis catastrophic. Mohammed Gammoudi won the 5,000m in14:05.01(48.4 secondsslower than Ron Clarke's13:16.6world record), and Kenya's Naftali Temu won the 10,000m in29:27.40(1 minute 48 secondsslower than Clarke's27:39.4world record). - The Rise of East African High-Altitude Runners: The 1968 Games marked the historic breakthrough of runners born and raised on the high plateaus of Kenya, Ethiopia, and Tunisia (
1,800 to 2,400 meters), who swept medals across every race from the 1,500m to the marathon (won by Ethiopia's Mamo Wolde in2:20:26).
In the 800 meters (~104 seconds), Mexico City's 22% drop in air resistance and 15% drop in aerobic VO2max canceled out to the tenth of a second; below 400 meters every sprint broke the world record, and above 5,000 meters every race slowed by over 6%.
Complete 1968 Mexico City Olympics Altitude Performance Table
The table below compares energy systems, 1968 Olympic winning marks, pre-1968 world records, and percentage performance shifts across the track and field program (full dataset in 1968-mexico-city-olympics-altitude-sprinting-jumps-vs-endurance-impact.csv):
1968 Olympic Event (2,240m) |
Primary Energy System | 1968 Winning Mark | Pre-1968 World Record | Shift vs. WR (%) | Aerodynamic vs. Hypoxic Mechanism |
|---|---|---|---|---|---|
| Men's Long Jump (Bob Beamon) | 100% Anaerobic (< 6s) |
8.90 m (29' 2.5") |
8.35 m |
+6.59% faster |
-22% air drag + 2.0 m/s wind; stood 23 yrs |
| Men's 200m (Tommie Smith) | Anaerobic ATP-PCr / Glycolysis | 19.83 s (WR) |
20.06 s |
+1.15% faster |
First sub-20s 200m; ~0.16s thin-air aid |
| Men's 100m (Jim Hines) | 100% Anaerobic (< 10s) |
9.95 s (WR) |
10.03 s |
+0.80% faster |
First electronic sub-10s 100m; ~0.07s drag gain |
| Men's 400m (Lee Evans) | Anaerobic Glycolysis (~44s) |
43.86 s (WR) |
44.06 s |
+0.45% faster |
First sub-44s 400m; stood 20 years until 1988 |
| Men's 5,000m (M. Gammoudi) | 85%+ Aerobic VO2max |
14:05.01 |
13:16.6 (R. Clarke) |
-6.08% slower |
+48.4 sec slower due to -15% VO2max |
| Men's 10,000m (Naftali Temu) | 92%+ Aerobic VO2max |
29:27.40 |
27:39.4 (R. Clarke) |
-6.51% slower |
+1 min 48 sec slower; altitude runners swept |
Want to compare how sprint, middle-distance, and endurance benchmarks scale across age cohorts, eras, and physiological norms? Analyze atmospheric soundings on Eranorms side by side.