
What Is a Temperature Inversion, and Why Does It Trap Winter Smog and Fog in Valleys?
On a clear winter morning in a mountain basin, you can often see a sharp, flat gray ceiling of haze sitting halfway up the surrounding peaks while the ski resorts above bask in bright sunshine. That atmospheric lid is a temperature inversion—a reversal of the normal vertical temperature profile of the lower atmosphere.
As documented in Inversion (meteorology), Smog, and the Twenty-Year Review of Outdoor Air Quality in Utah (MDPI), inversions suppress vertical mixing and allow fine particulates (PM2.5) to spike well past federal health limits. Track live local air quality, temperature, and inversion conditions in Eranorms when planning outdoor runs or commutes.
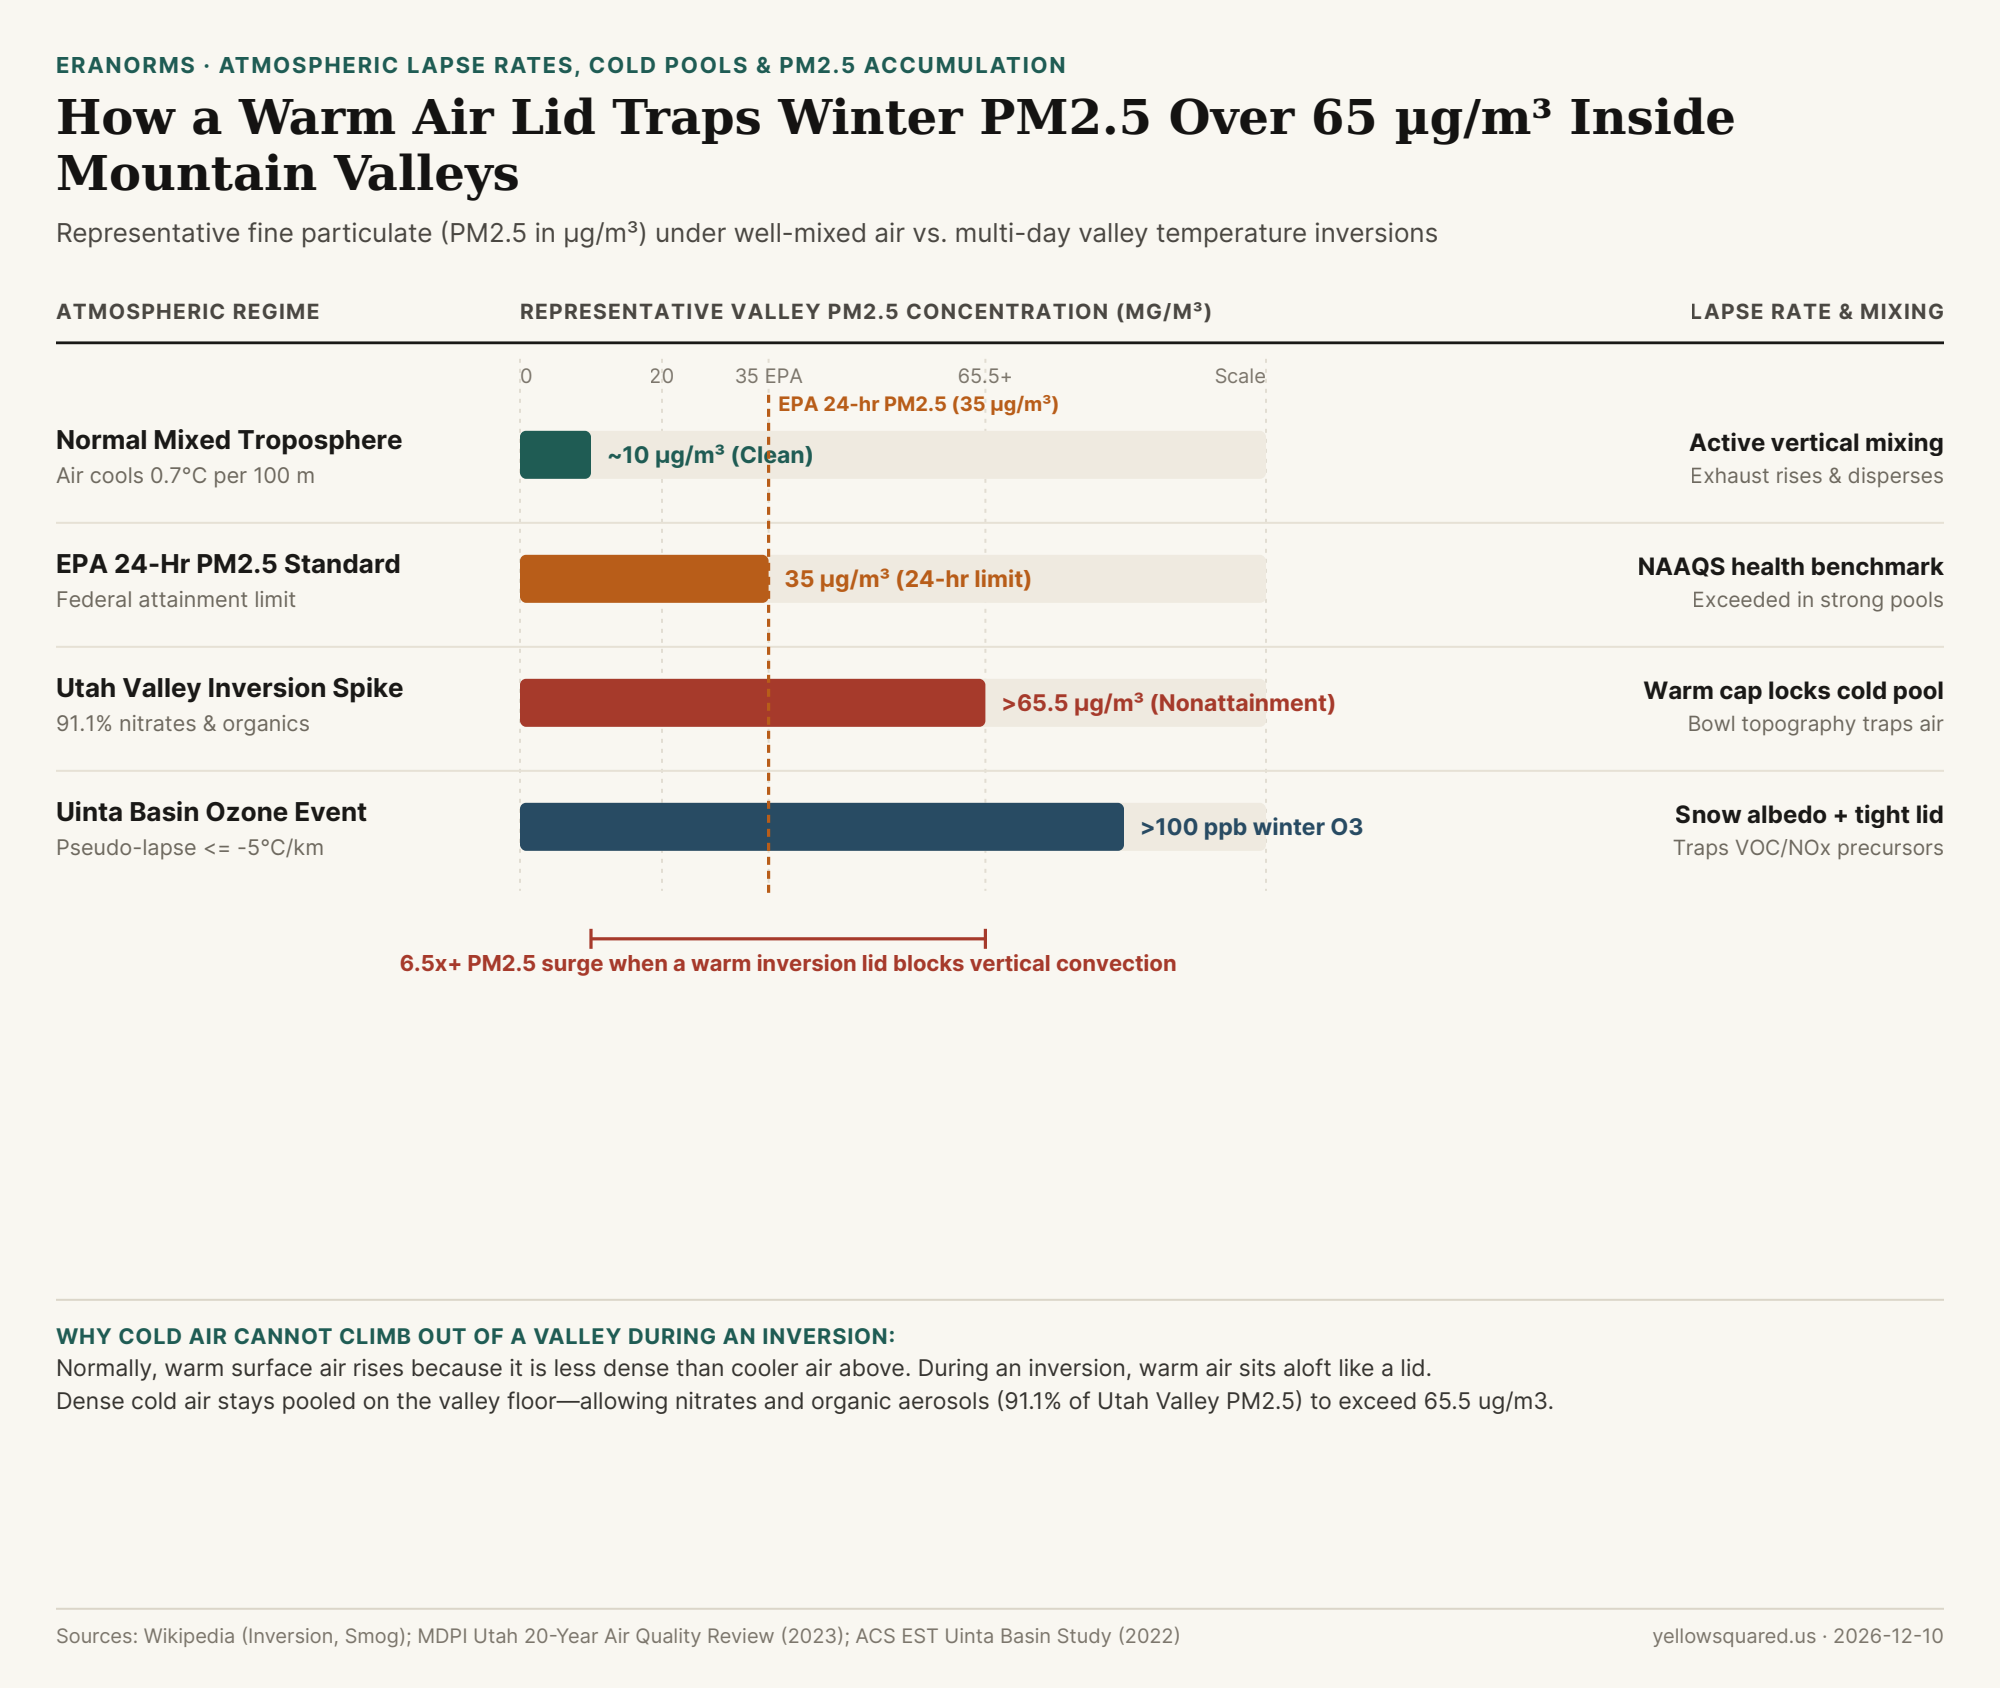
PM2.5 in µg/m³) under well-mixed conditions vs. valley temperature inversions. Sources: Inversion (meteorology) and MDPI Utah Air Quality Review · Download CSV dataset.Normal Lapse Rate vs. Inverted Warm Lid
- Normal Mixing: Because the sun heats the ground from below, tropospheric air normally cools with height (around
0.7°C per 100 m). Warm air near the surface is buoyant, rising through cooler air above and dispersing vehicle exhaust and woodsmoke. - Radiation & Subsidence Inversions: On calm, clear winter nights, snow-covered ground radiates heat rapidly into space, chilling the bottom layer of air while warmer air—often reinforced by sinking high-pressure subsidence—sits aloft. Because cold air is denser than warm air, it cannot rise through the warm cap.
"During Utah Valley winter inversions, nitrates and organic aerosols account for 91.1 percent of PM2.5 mass—driving concentrations past 65.5 µg/m³ beneath a warm atmospheric lid."
Why Bowl-Shaped Valleys Hold Smog for Days
In mountain basins such as Salt Lake Valley, Cache Valley, Los Angeles, and Almaty, surrounding ridges block horizontal winds while the inversion lid blocks vertical convection. Worse, bright snowpack reflects incoming sunlight instead of warming the valley floor—meaning a strong cold pool can persist until a passing storm front scours out the basin.
Atmospheric Regimes & Air Quality Impact Table
Compare normal mixing against three common inversion patterns (download the raw CSV dataset):
| Atmospheric Regime | Altitude Temp Trend | Vertical Mixing | Valley Air Quality Impact |
|---|---|---|---|
| Normal Troposphere | Cools ~0.7°C / 100 m |
Active convection | Baseline ~10 µg/m³ PM2.5 |
| Nocturnal Radiation Cap | Warms near surface | Suppressed overnight | Morning valley fog & woodsmoke |
| Multi-Day Cold Pool | Pseudo-lapse <= -5°C/km |
Locked basin air | PM2.5 >65.5 µg/m³ (exceeds EPA 35) |
| Subsidence Marine Cap | Sinking air warms aloft | Capped marine layer | Coastal stratus & summer smog |