
What Is a Temperature Inversion?
A temperature inversion is an atmospheric condition where a layer of warm air settles over colder air near the ground — completely reversing the normal tropospheric pattern where air cools with altitude. This warm overhead layer acts like an airtight lid, capping vertical convection and trapping dense valley fog, woodstove smoke, vehicle exhaust, and dangerous fine particulate pollution (PM2.5) on valley floors for days or weeks until a powerful Pacific storm or strong wind front breaks the stagnant cap.
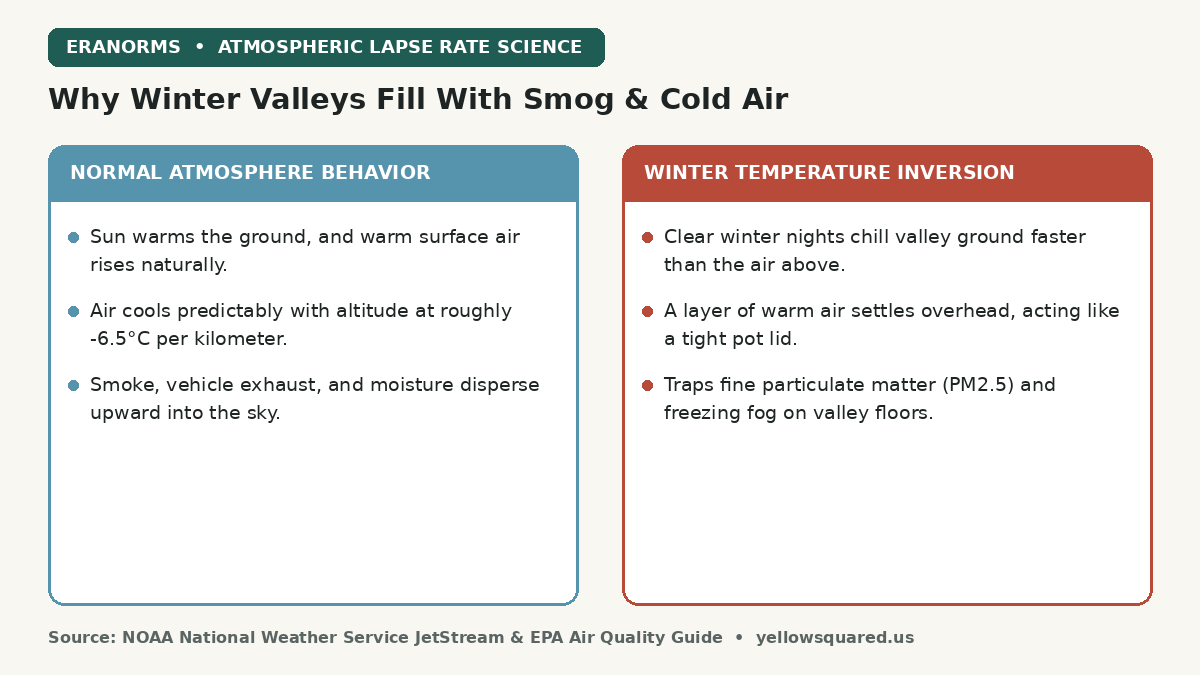
Every winter, residents of mountain-ringed valleys across the American West — including the Salt Lake Valley, Boise Basin, Central Valley of California, and Puget Sound lowlands — experience the eerie contrast of temperature inversions. On the valley floor, the sky is a murky, freezing soup of gray fog and acrid smoke with air quality index (AQI) readings deep in the unhealthy red zone. Yet drive 2,000 feet up into the foothills, and you emerge into bright sunshine, azure skies, and temperatures that are 15°F warmer than in the city center.
Warm air is less dense than cold air; when a warm layer sits on top of cold valley air, natural buoyant lift stops and the atmosphere cannot breathe.
How a Radiation Inversion Forms: The Physics of Winter Valleys
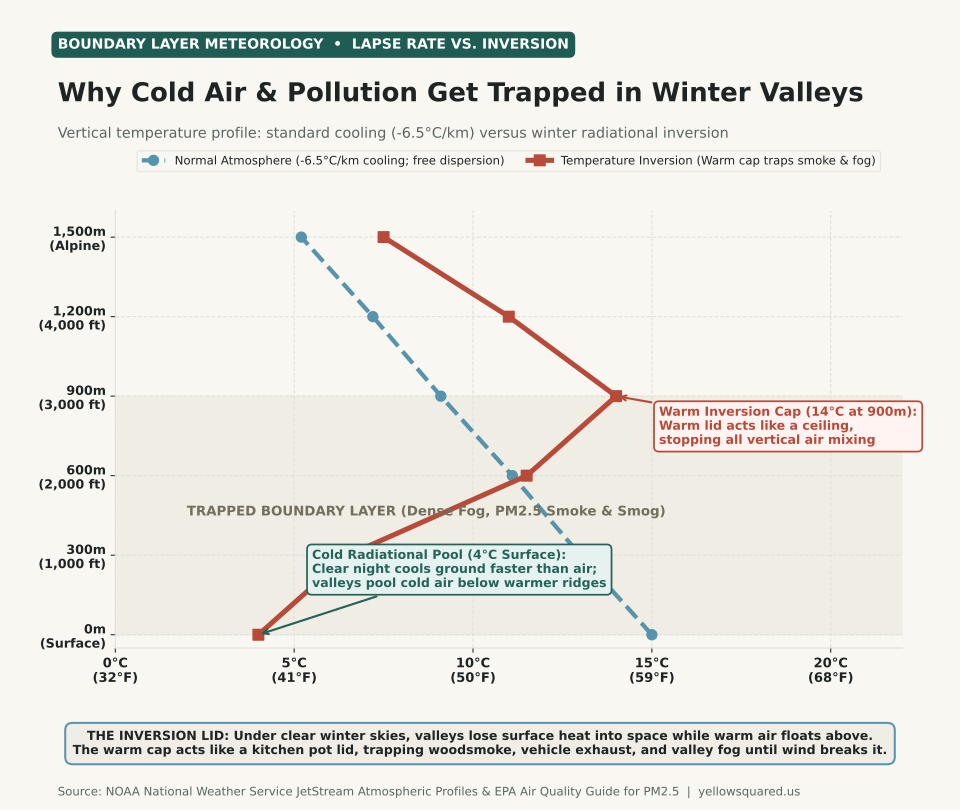
Under ordinary weather conditions, sunlight warms the Earth's surface during the day, which in turn warms the lowest layer of air. Because warm air is buoyant, it rises, cools at the standard environmental lapse rate of roughly -6.5°C per 1,000 meters (-3.5°F per 1,000 feet), and dilutes surface pollution throughout the deep troposphere.
During winter, two factors combine to flip this profile upside down:
- Nocturnal radiational cooling: High-pressure systems bring long nights (>14 hours of darkness in December and January) and clear, cloudless skies. The ground radiates thermal infrared energy into outer space much faster than the dry air above can cool.
- Dense cold air drainage: Cold air is heavier and denser than warm air. As air chills along mountain ridges and slopes, gravity pulls it downward into topographic basins and river valleys — a phenomenon known as katabatic drainage.
- Subsidence warming from above: High-pressure ridges cause air aloft to sink slowly. Sinking air compresses and warms adiabatically (roughly 5.5°F per 1,000 feet of descent). When this descending warm layer meets the pool of frozen valley air, a sharp inversion cap forms between 1,000 and 3,000 feet above the ground.
Why Air Pollution Spikes to Dangerous Levels During Inversions
According to the U.S. Environmental Protection Agency (EPA), winter inversions are responsible for the most severe non-wildfire air pollution episodes in North America. Because the vertical mixing height collapses from several thousand meters down to just 200 to 500 meters, emissions from vehicle tailpipes, industrial stacks, and residential woodstoves are confined to a tiny volume of air.
Fine particulate matter measuring 2.5 microns or less (PM2.5) cannot escape. Over three to seven days of stagnation, PM2.5 concentrations routinely climb past 55 to 150 µg/m3, penetrating deep into human lung tissue and triggering asthma and cardiovascular events. Secondary chemical reactions between ammonia from agriculture and nitrogen oxides from highway traffic create dense secondary ammonium nitrate particles, adding a milky yellow-white haze to the low-altitude radiation fog (tule fog).
How Temperature Inversions Break
An inversion persists until one of three atmospheric forces dismantles the capping layer:
- Frontal passage: A vigorous Pacific low-pressure storm brings strong winds (>15 to 25 mph) that mechanically churn and mix the stagnant boundary layer.
- Solar surface heating: In late February and March, higher sun angles and longer days warm the valley floor enough to erode the inversion from the ground up.
- Cold air advection aloft: An incoming arctic trough cools the upper atmosphere, restoring the normal lapse rate and releasing convective lift.
To examine historical daily temperature ranges and compare winter normals across reporting stations, explore the interactive Eranorms climate explorer.