
What Is 'Expose to the Right' (ETTR)? Why Brighter RAW Exposures Have Less Shadow Noise
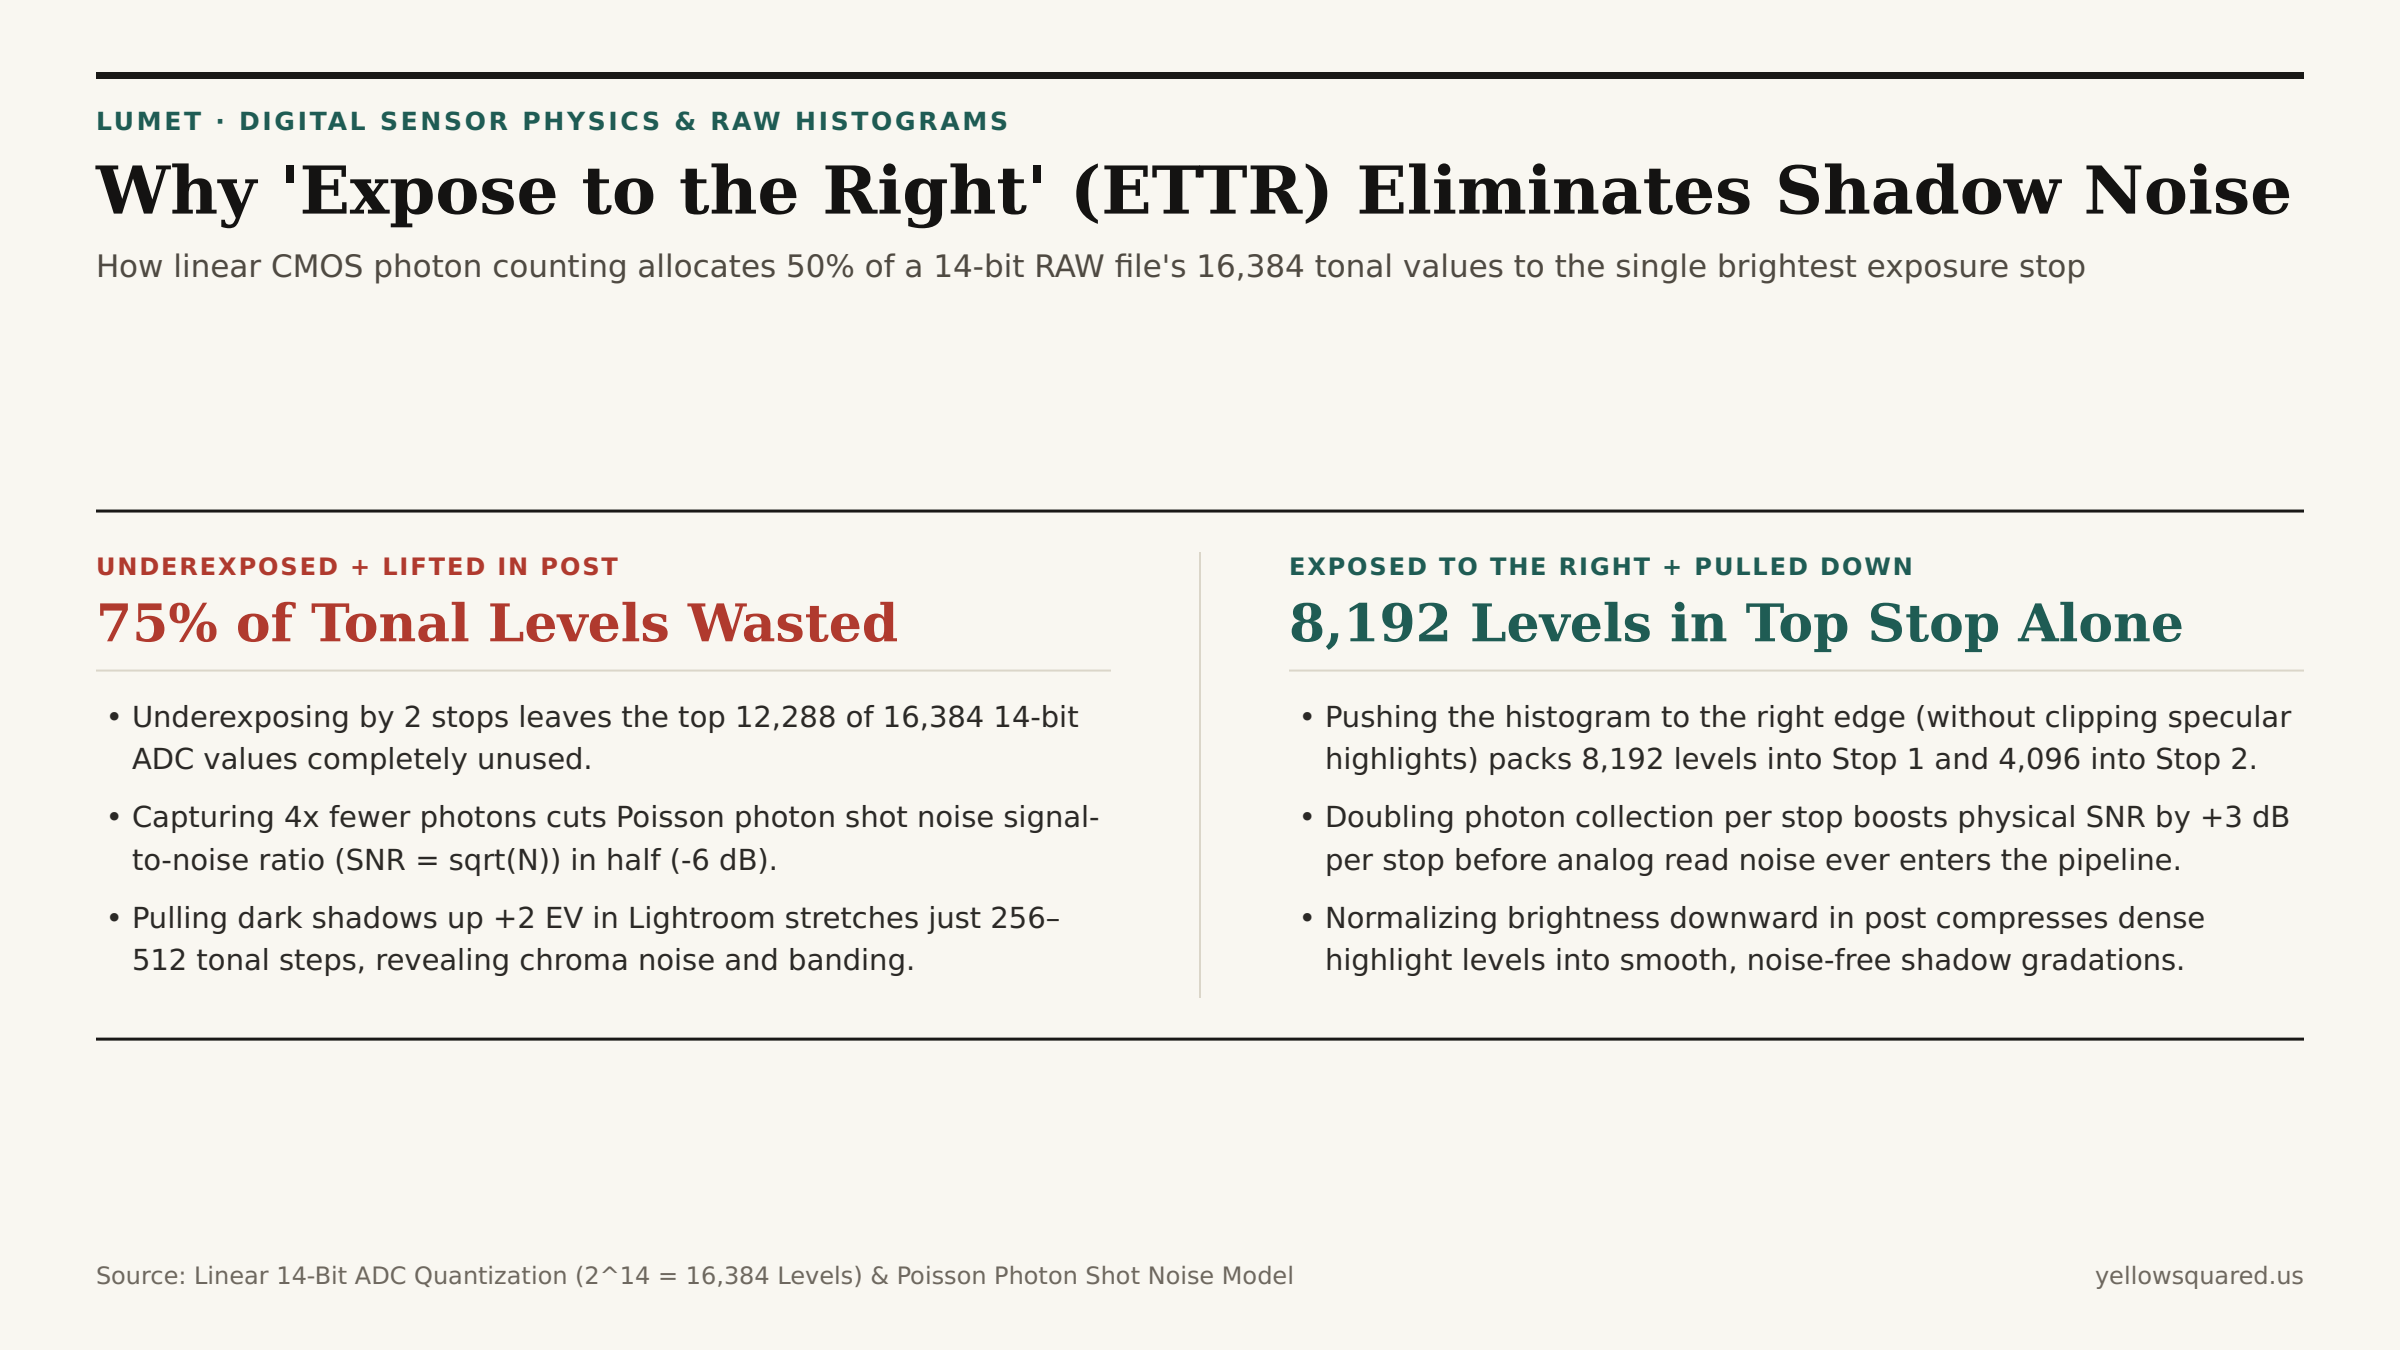
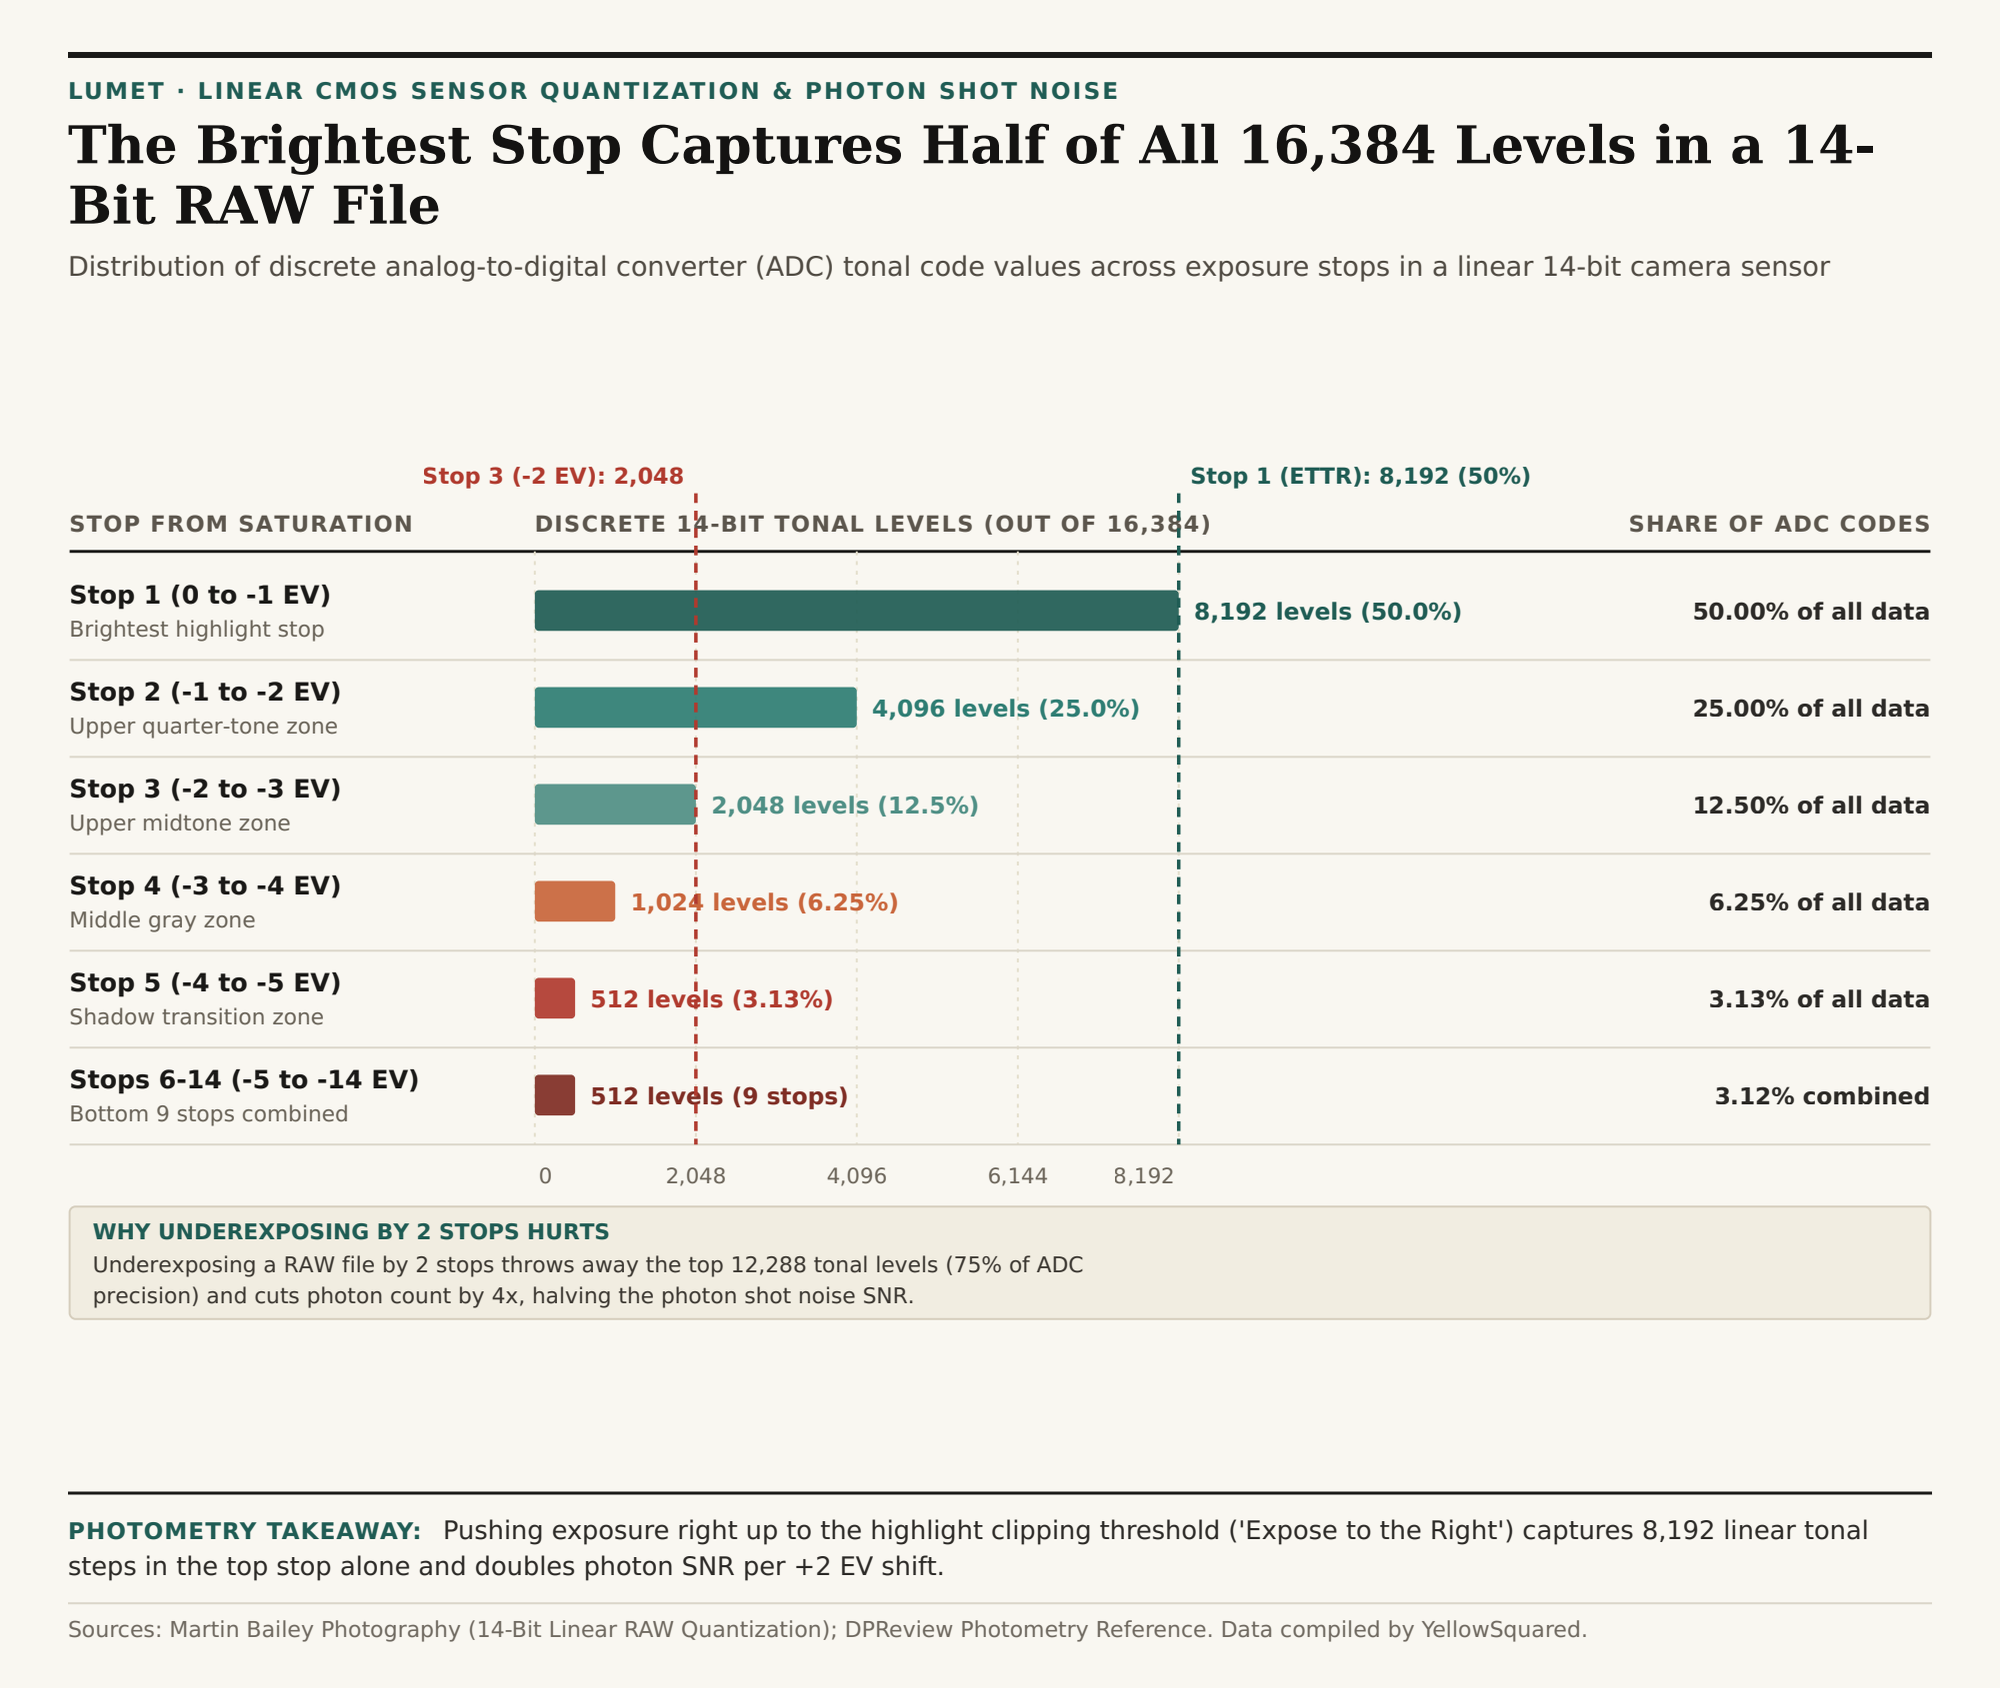
Look at the exposure histogram on the back of a digital camera and you are seeing a logarithmic view of light mapped over a strictly linear silicon sensor. Because a 14-bit CMOS analog-to-digital converter (ADC) divides the physical saturation capacity of a pixel into 214 = 16,384 discrete voltage steps in direct proportion to photon count, the single brightest stop of exposure (from 0 EV clipping down to -1 EV) contains 8,192 tonal levels — exactly 50.0% of all digital information the sensor can record.
This linear quantization structure is the physical foundation of "Expose to the Right" (ETTR), a technique first formalized by Michael Reichmann and Thomas Knoll during the early days of camera RAW processing and detailed in Martin Bailey's 14-Bit Linear RAW Quantization Analysis. Rather than centering an exposure around middle gray and lifting dark shadows later in software, ETTR pushes the camera's exposure as far toward the right edge of the histogram as possible without clipping important specular highlights, then pulls overall brightness back down during RAW conversion. Before your next high-contrast shoot, Analyze scene lighting in Lumet to spot highlight clipping thresholds and shadow contrast ratios across your frame.
The Binary Math of Linear 14-Bit RAW Quantization
Human vision perceives brightness logarithmically (each doubling of luminance looks like one equal "stop" or exposure value, EV), and standard 8-bit JPEG files apply a non-linear gamma curve so that each stop gets a roughly balanced share of the 256 available values. A camera's RAW file, however, records the direct linear electron count inside each photodiode well before any gamma curve is applied. Every time exposure drops by one stop (halving the number of photons hitting the sensor), the number of available digital code values is cut in half:
- Stop 1 (0 to -1 EV below saturation): Consumes 8,192 levels (50.00% of the entire 14-bit ADC scale).
- Stop 2 (-1 to -2 EV): Consumes 4,096 levels (25.00% of total ADC codes). Together, the top two stops hold 12,288 levels (75.0%).
- Stop 3 (-2 to -3 EV): Consumes 2,048 levels (12.50%) — the zone where an 18% reflectance gray card typically lands under standard metering.
- Stop 4 (-3 to -4 EV) and Stop 5 (-4 to -5 EV): Drop to 1,024 levels (6.25%) and 512 levels (3.13%) respectively.
- Stops 6 through 14 (-5 to -14 EV combined): Share the remaining 512 levels (3.12% combined), with the deepest shadow stops reduced to just 16, 8, 4, 2, and 1 discrete steps.
Why Photon Shot Noise — Not Just Bit Depth — Drives Shadow Grain
As photometry discussions in the DPReview Photometry & ETTR Technical Reference emphasize, avoiding posterization in 14-bit ADC steps is only half of the equation; the even larger benefit of ETTR comes from overcoming Poisson photon shot noise. Light arrives at a camera sensor as discrete packets (photons), and random arrival fluctuations follow a Poisson distribution where the physical noise equals the square root of the captured signal (sigma = sqrt(N)).
"Because photon shot noise grows with the square root of photon count while the image signal grows linearly, multiplying photon capture by 4x (+2 EV exposure) increases signal by 4x but noise by only 2x — doubling the physical Signal-to-Noise Ratio (+6 dB)."
When you deliberately add +1 EV to +2 EV of exposure via shutter speed or aperture (at base ISO) so that your highlights kiss the right edge of the histogram, you flood the shadow photodiodes with two to four times as many photons before downstream electronic read noise is added. When you pull the exposure slider down by -1.5 EV in post-processing, you compress both the signal and the noise Floor down into the dark tones, yielding velvet-smooth shadows with zero chroma blotching.
| Stop Below Clipping | Histogram Zone | 14-Bit Tonal Levels | Share of ADC Codes | Photon SNR vs. Peak | Post-Processing Shadow Pull Impact |
|---|---|---|---|---|---|
| Stop 1 (0 to -1 EV) | Brightest Highlights | 8,192 | 50.00% | 0.0 dB (Peak SNR) | Maximum tonal gradation; zero posterization |
| Stop 2 (-1 to -2 EV) | Upper Quarter-Tones | 4,096 | 25.00% | -3.0 dB | Clean studio highlight roll-off |
| Stop 3 (-2 to -3 EV) | Upper Midtones | 2,048 | 12.50% | -6.0 dB | Standard 18% gray card metering zone |
| Stop 4 (-3 to -4 EV) | Midtones | 1,024 | 6.25% | -9.0 dB | Moderate photon shot noise |
| Stop 5 (-4 to -5 EV) | Upper Shadows | 512 | 3.13% | -12.0 dB | Noticeable grain if lifted +2 EV |
| Stops 6–14 (-5 to -14 EV) | Deep Shadows Combined | 512 total | 3.12% | -15.0 to -42.0 dB | Severe banding & read-noise floor if pushed |
When to Use ETTR (and When Dual-Gain ISO Invariance Applies)
True ETTR only improves Signal-to-Noise Ratio when you increase actual light hitting the sensor — meaning a slower shutter speed or a wider aperture at base ISO. Raising the ISO dial on a modern "ISO-invariant" (dual conversion gain) sensor does not collect more photons; it simply amplifies the existing charge and risks clipping highlights prematurely. Furthermore, because the rear LCD histogram on most cameras is generated from an in-camera 8-bit JPEG preview (which clips roughly 0.7 to 1.3 stops earlier than the true RAW file), setting your camera picture profile to a flat/neutral curve gives the truest view of headroom. To inspect real-time luminance distribution and highlight headroom on your own reference frames, Analyze scene lighting in Lumet and download the 14-bit quantization CSV dataset.