
What Is the Planning Fallacy, and Why Do Projects Almost Always Take Longer Than We Estimate?
Ask an experienced software engineer, academic researcher, or home-renovation contractor how long an upcoming project will take—even when they know similar past projects ran weeks behind schedule—and they will almost always produce an optimistic deadline that slips. In behavioral economics and cognitive psychology, this systematic bias is known as the planning fallacy. First formulated by Daniel Kahneman and Amos Tversky in 1979, the planning fallacy describes our tendency to underestimate task-completion times by mentally simulating an ideal, step-by-step execution scenario while discounting historical base rates of interruptions, bugs, and competing commitments.
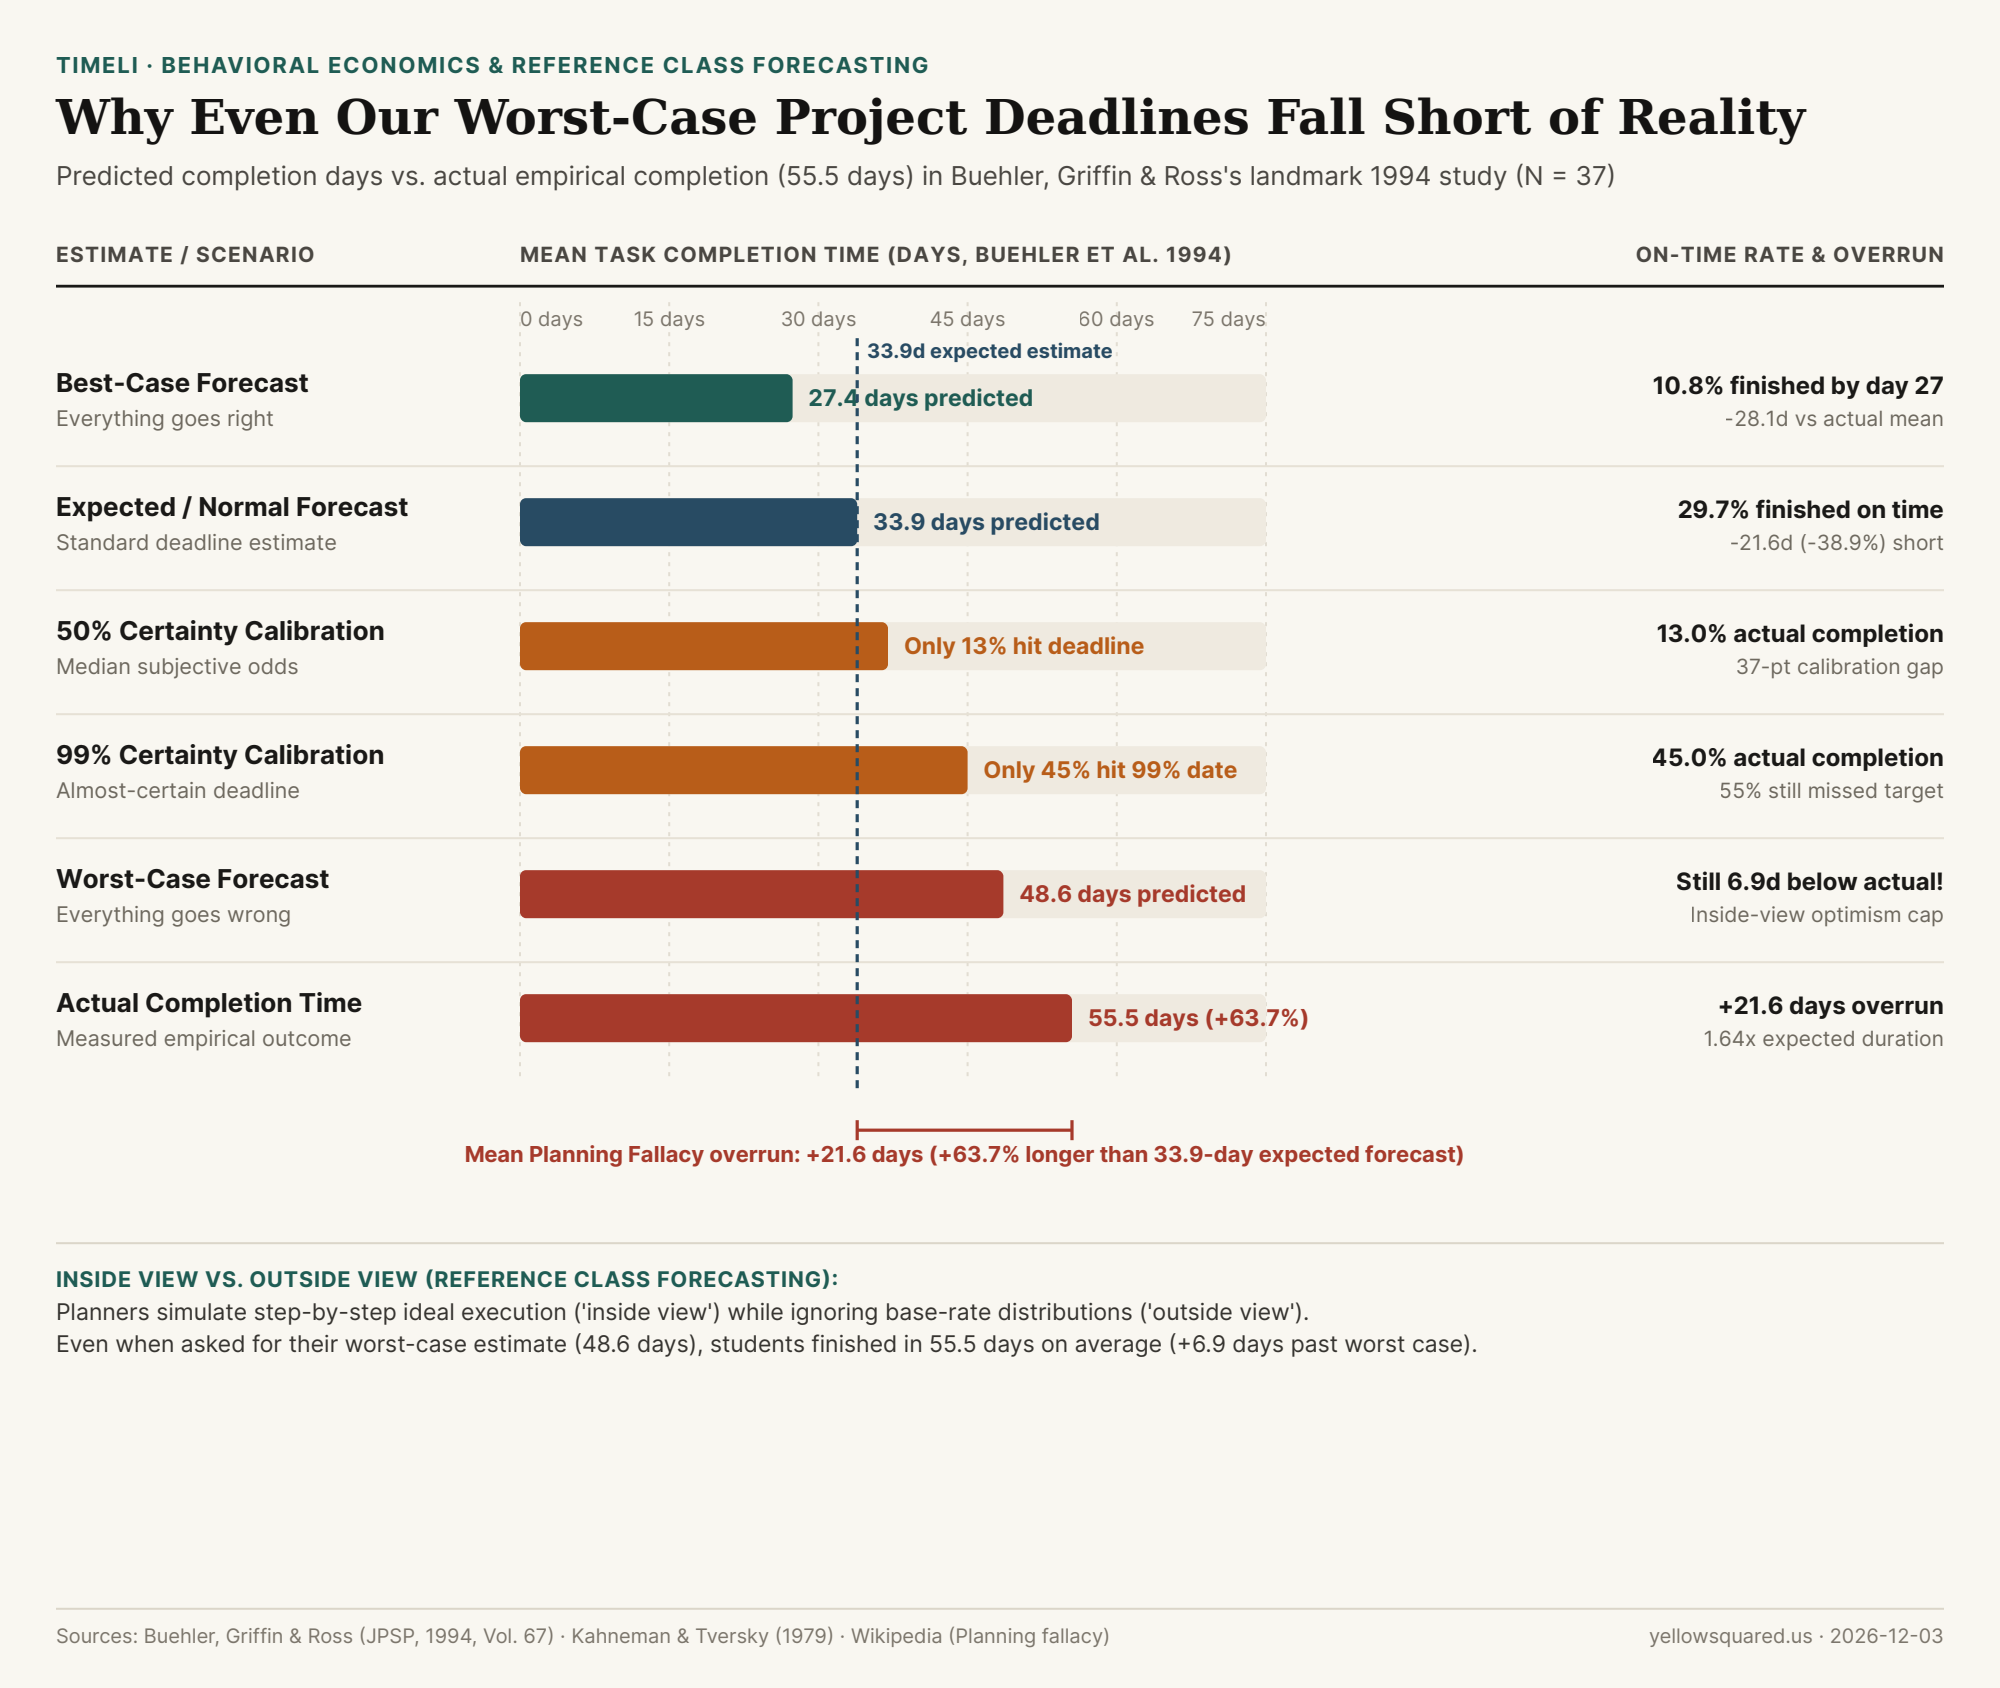
The empirical scale of this bias was measured in a landmark 1994 study by psychologists Roger Buehler, Dale Griffin, and Michael Ross, published in the Journal of Personality and Social Psychology (1994, Vol. 67, No. 3). When tracking N = 37 senior psychology students completing their honors theses, Buehler and colleagues found that students predicted their projects would take an average of 33.9 days—yet actual completion took an average of 55.5 days, a mean overrun of +21.6 days (`+63.7%` longer than predicted). Even more remarkably, the actual mean completion time (`55.5 days`) exceeded the students' average worst-case estimate (`48.6 days`) by nearly a full week (`+6.9 days`). To replace optimistic memory with empirical base rates on your own daily work, you can Log daily focus blocks and moments in Timeli to build an objective timeline of how long tasks actually take.
Inside the 1994 Buehler, Griffin & Ross Experiments: Why Even 99%-Certain Deadlines Fail
In Study 1 of Buehler, Griffin, and Ross's JPSP paper, researchers asked participants to estimate three distinct completion horizons: when they would finish "if everything went as well as it possibly could" (`27.4 days`), when they expected to finish (`33.9 days`), and when they would finish "if everything went as poorly as it possibly could" (`48.6 days`). Only 10.8% of students finished by their best-case date, only 29.7% (`roughly 3 in 10`) finished by their expected date, and barely half (`51.4%`) finished even by their self-defined worst-case catastrophe date.
To test whether people were simply stating aspirational targets rather than true statistical medians, follow-up calibration studies asked participants to specify deadlines at which they were 50% certain, 75% certain, and 99% ("almost completely") certain they would be done:
- 50% Subjective Probability Deadline: Only
13%of participants actually finished on time (a37-percentage-pointoverconfidence gap). - 75% Subjective Probability Deadline: Only
19%finished on time (a56-percentage-pointoverconfidence gap). - 99% Subjective Probability Deadline: Only
45%finished on time—meaning55%of participants missed a deadline they believed had only a 1-in-100 chance of slipping.
"When planners construct a timeline, they adopt the 'inside view'—mentally walking through the specific steps required to succeed—which automatically excludes the combinatorial tail of unexpected bugs, illness, scope creep, and competing priorities."
The Inside View vs. Outside View (Reference Class Forecasting)
Why doesn't past experience automatically cure the planning fallacy? When Buehler, Griffin, and Ross recorded think-aloud protocols while participants generated estimates, they discovered two cognitive mechanisms that insulate future forecasts from past overruns:
- Singular ("Inside View") Mental Simulation: Only
7%of verbalized thoughts during estimation referenced past completion times on similar tasks (`distributional / outside-view data`). Instead, planners focused exclusively on the unique mechanics of the current task and how they intended to execute it. - External Attribution of Past Delays: When reminded of past missed deadlines, participants attributed those delays to one-off external accidents ("my computer crashed that week" or "a client had an emergency") that they assumed would not recur—forgetting that while the exact same interruption rarely repeats, some interruption from the broader distribution almost always occurs.
| Forecast Type / Calibration Level | Predicted / Calibrated Duration | Empirical Actual Mean | On-Time Completion Rate | Mean Overrun / Multiplier |
|---|---|---|---|---|
| Best-Case Estimate ("Everything goes well") | 27.4 days |
55.5 days |
10.8% |
+28.1 days (2.03x best-case) |
| Expected / Standard Estimate | 33.9 days |
55.5 days |
29.7% |
+21.6 days (1.64x / +63.7%) |
| 50% Probability Calibration | ~37.0 days |
55.5 days |
13.0% |
37-pt calibration shortfall |
| 75% Probability Calibration | ~41.5 days |
55.5 days |
19.0% |
56-pt calibration shortfall |
| 99% Probability Calibration ("Almost certain") | ~45.0 days |
55.5 days |
45.0% |
55% still missed 99% deadline |
| Worst-Case Estimate ("Everything goes poorly") | 48.6 days |
55.5 days |
51.4% |
+6.9 days beyond worst-case |
How to Apply a 1.64x Reference-Class Multiplier to Your Schedule
To defeat the planning fallacy, Daniel Kahneman and Dan Lovallo formalized Reference Class Forecasting: instead of summing idealized task steps, look up the empirical distribution of how long your last five comparable projects actually took from start to finish, and multiply your initial inside-view estimate by your historical overrun ratio (in Buehler et al.'s baseline, 55.5 / 33.9 = 1.64x). By taking five seconds to Log daily focus blocks and moments in Timeli whenever you start and finish a milestone, you replace wishful memory with an exact personal reference class.