
What Is the Planning Fallacy? Why Projects Take Nearly Twice as Long as You Estimate
Ask a software engineer, graduate student, or home-renovation contractor how long an upcoming project will take, and they will give you a thoughtful estimate — say, five weeks. Ask them to add a safety cushion for unexpected setbacks, and they might stretch that number to seven weeks. Yet when researchers track actual completion timestamps, projects routinely take 64% to 100% longer than the initial realistic forecast, often blowing past even the planner's stated "worst-case" scenario. In behavioral decision science, this systematic bias is called the Planning Fallacy.
First proposed by Daniel Kahneman and Amos Tversky in 1979 and empirically quantified by psychologists Roger Buehler, Dale Griffin, and Michael Ross in their landmark 1994 Journal of Personality and Social Psychology paper (Buehler, Griffin & Ross, 1994 — "Exploring the Planning Fallacy: Why People Underestimate Their Task Completion Times"), the planning fallacy occurs even when people have completed dozens of similar projects in the past and know they usually run late. To test how historical overrun multipliers reshape your own project roadmap, Test deadline buffers in Timeli.
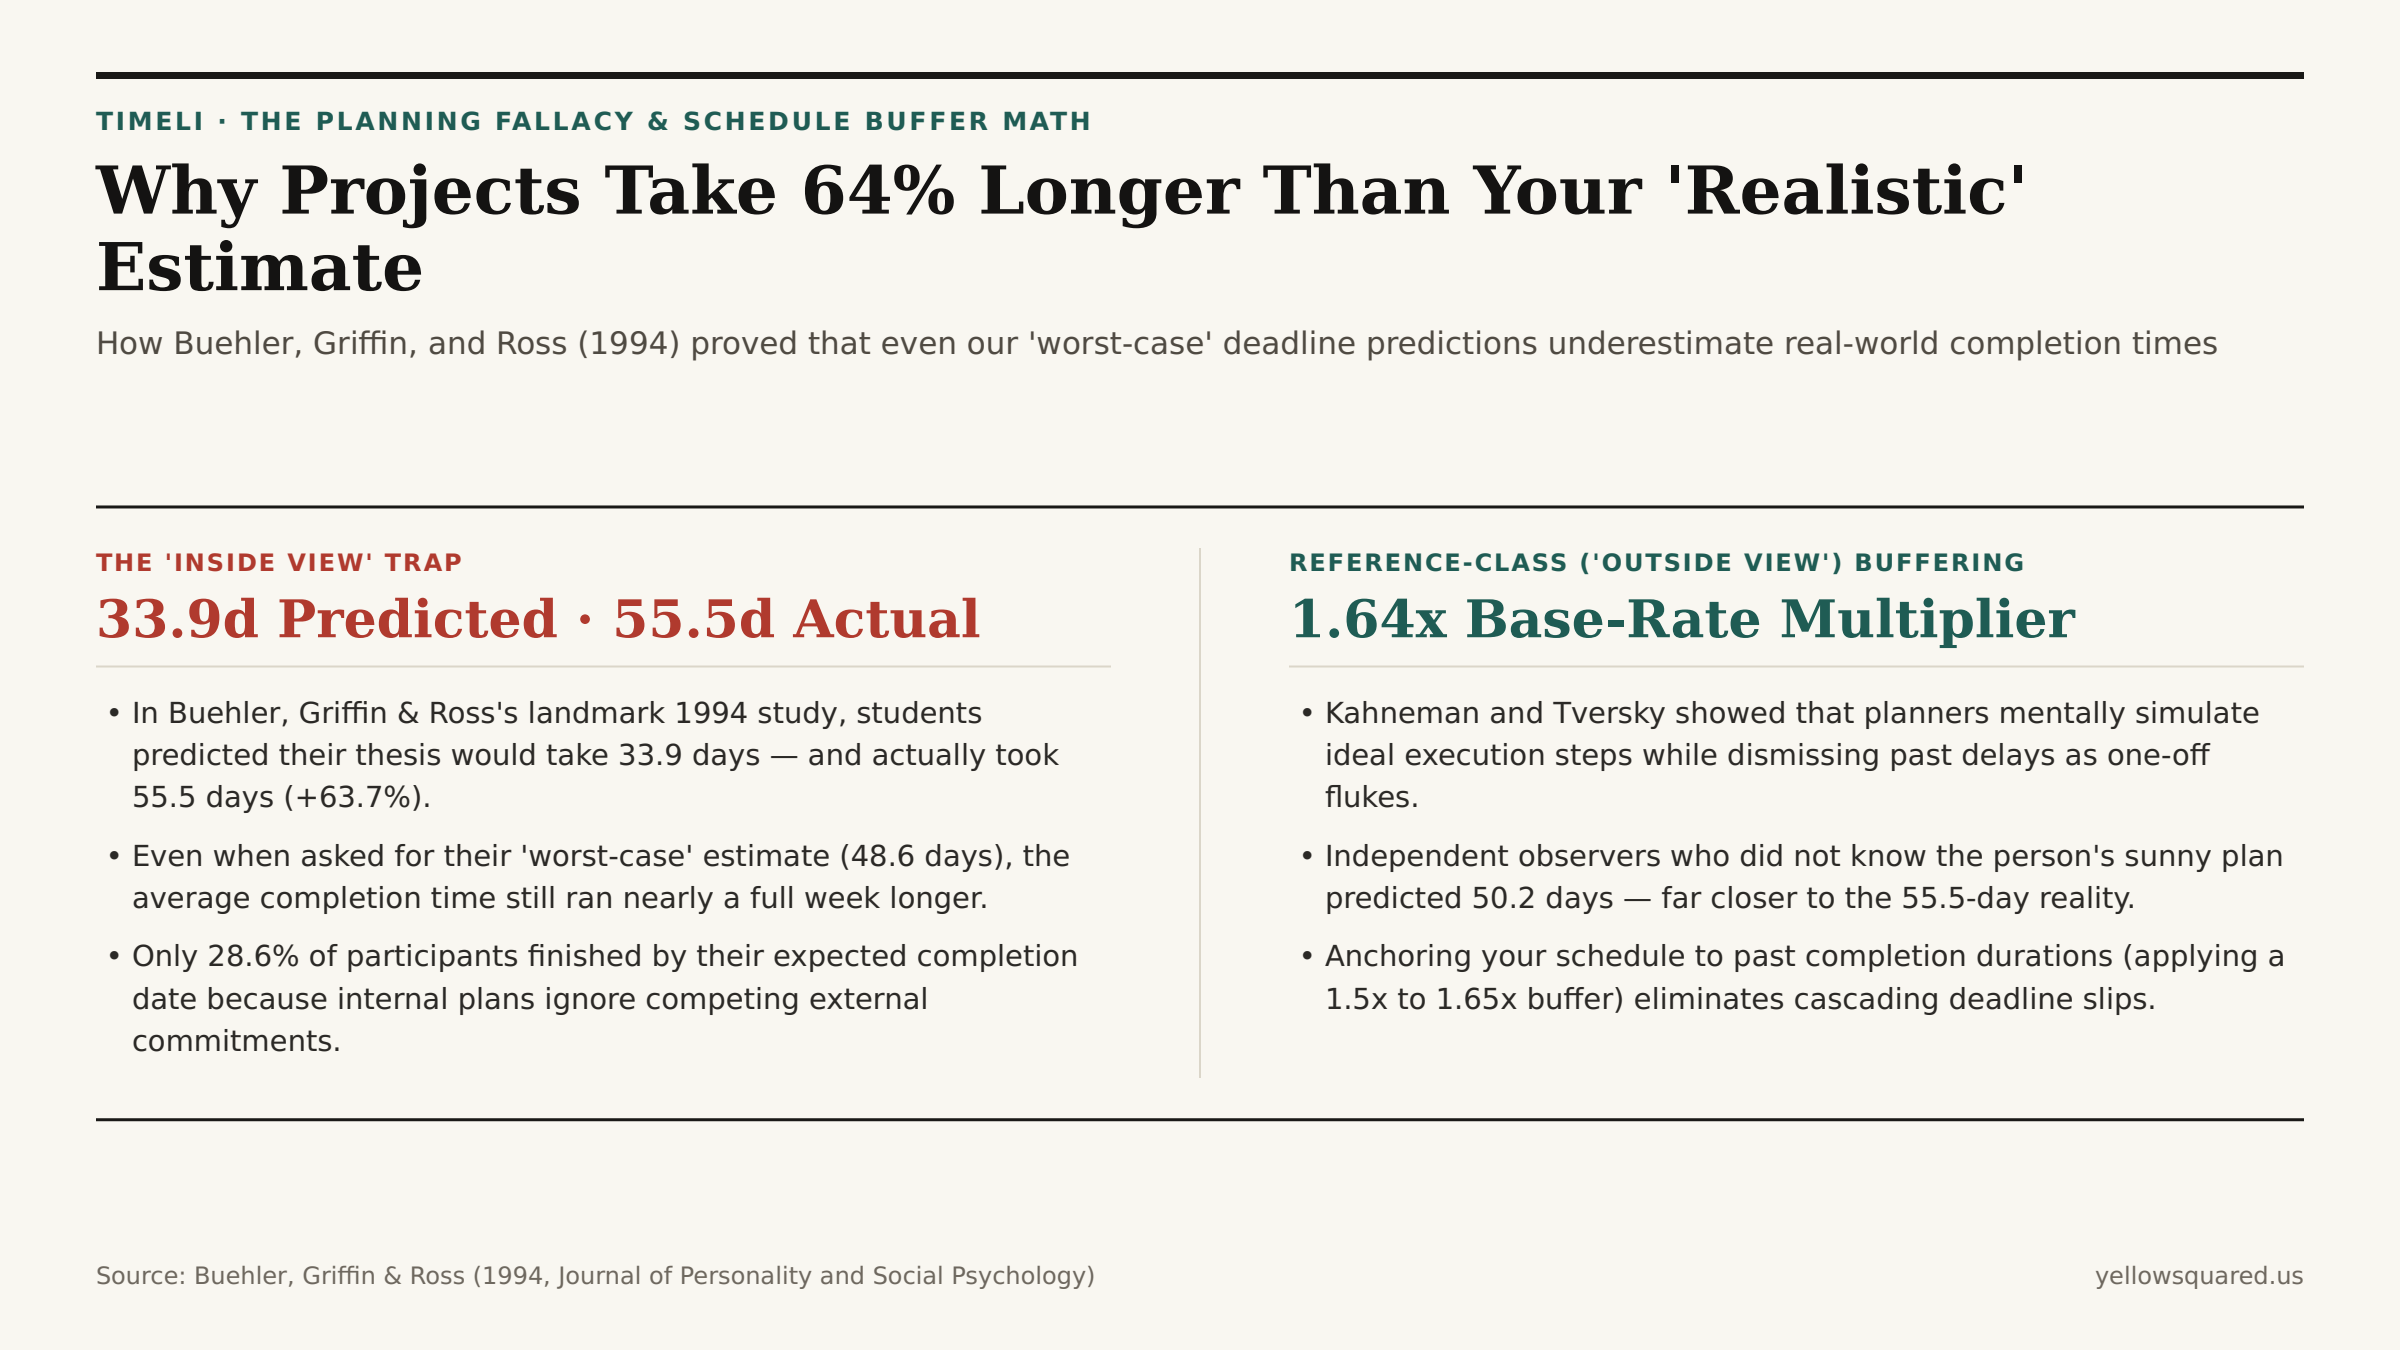
Inside the 1994 Buehler, Griffin & Ross Experiments (33.9 vs. 55.5 Days)
To measure how severely people underestimate complex deadlines — and whether asking for a "worst-case" estimate fixes the problem — Buehler, Griffin, and Ross (1994) tracked psychology honors students completing their mandatory senior thesis and asked each student for three distinct timeline predictions:
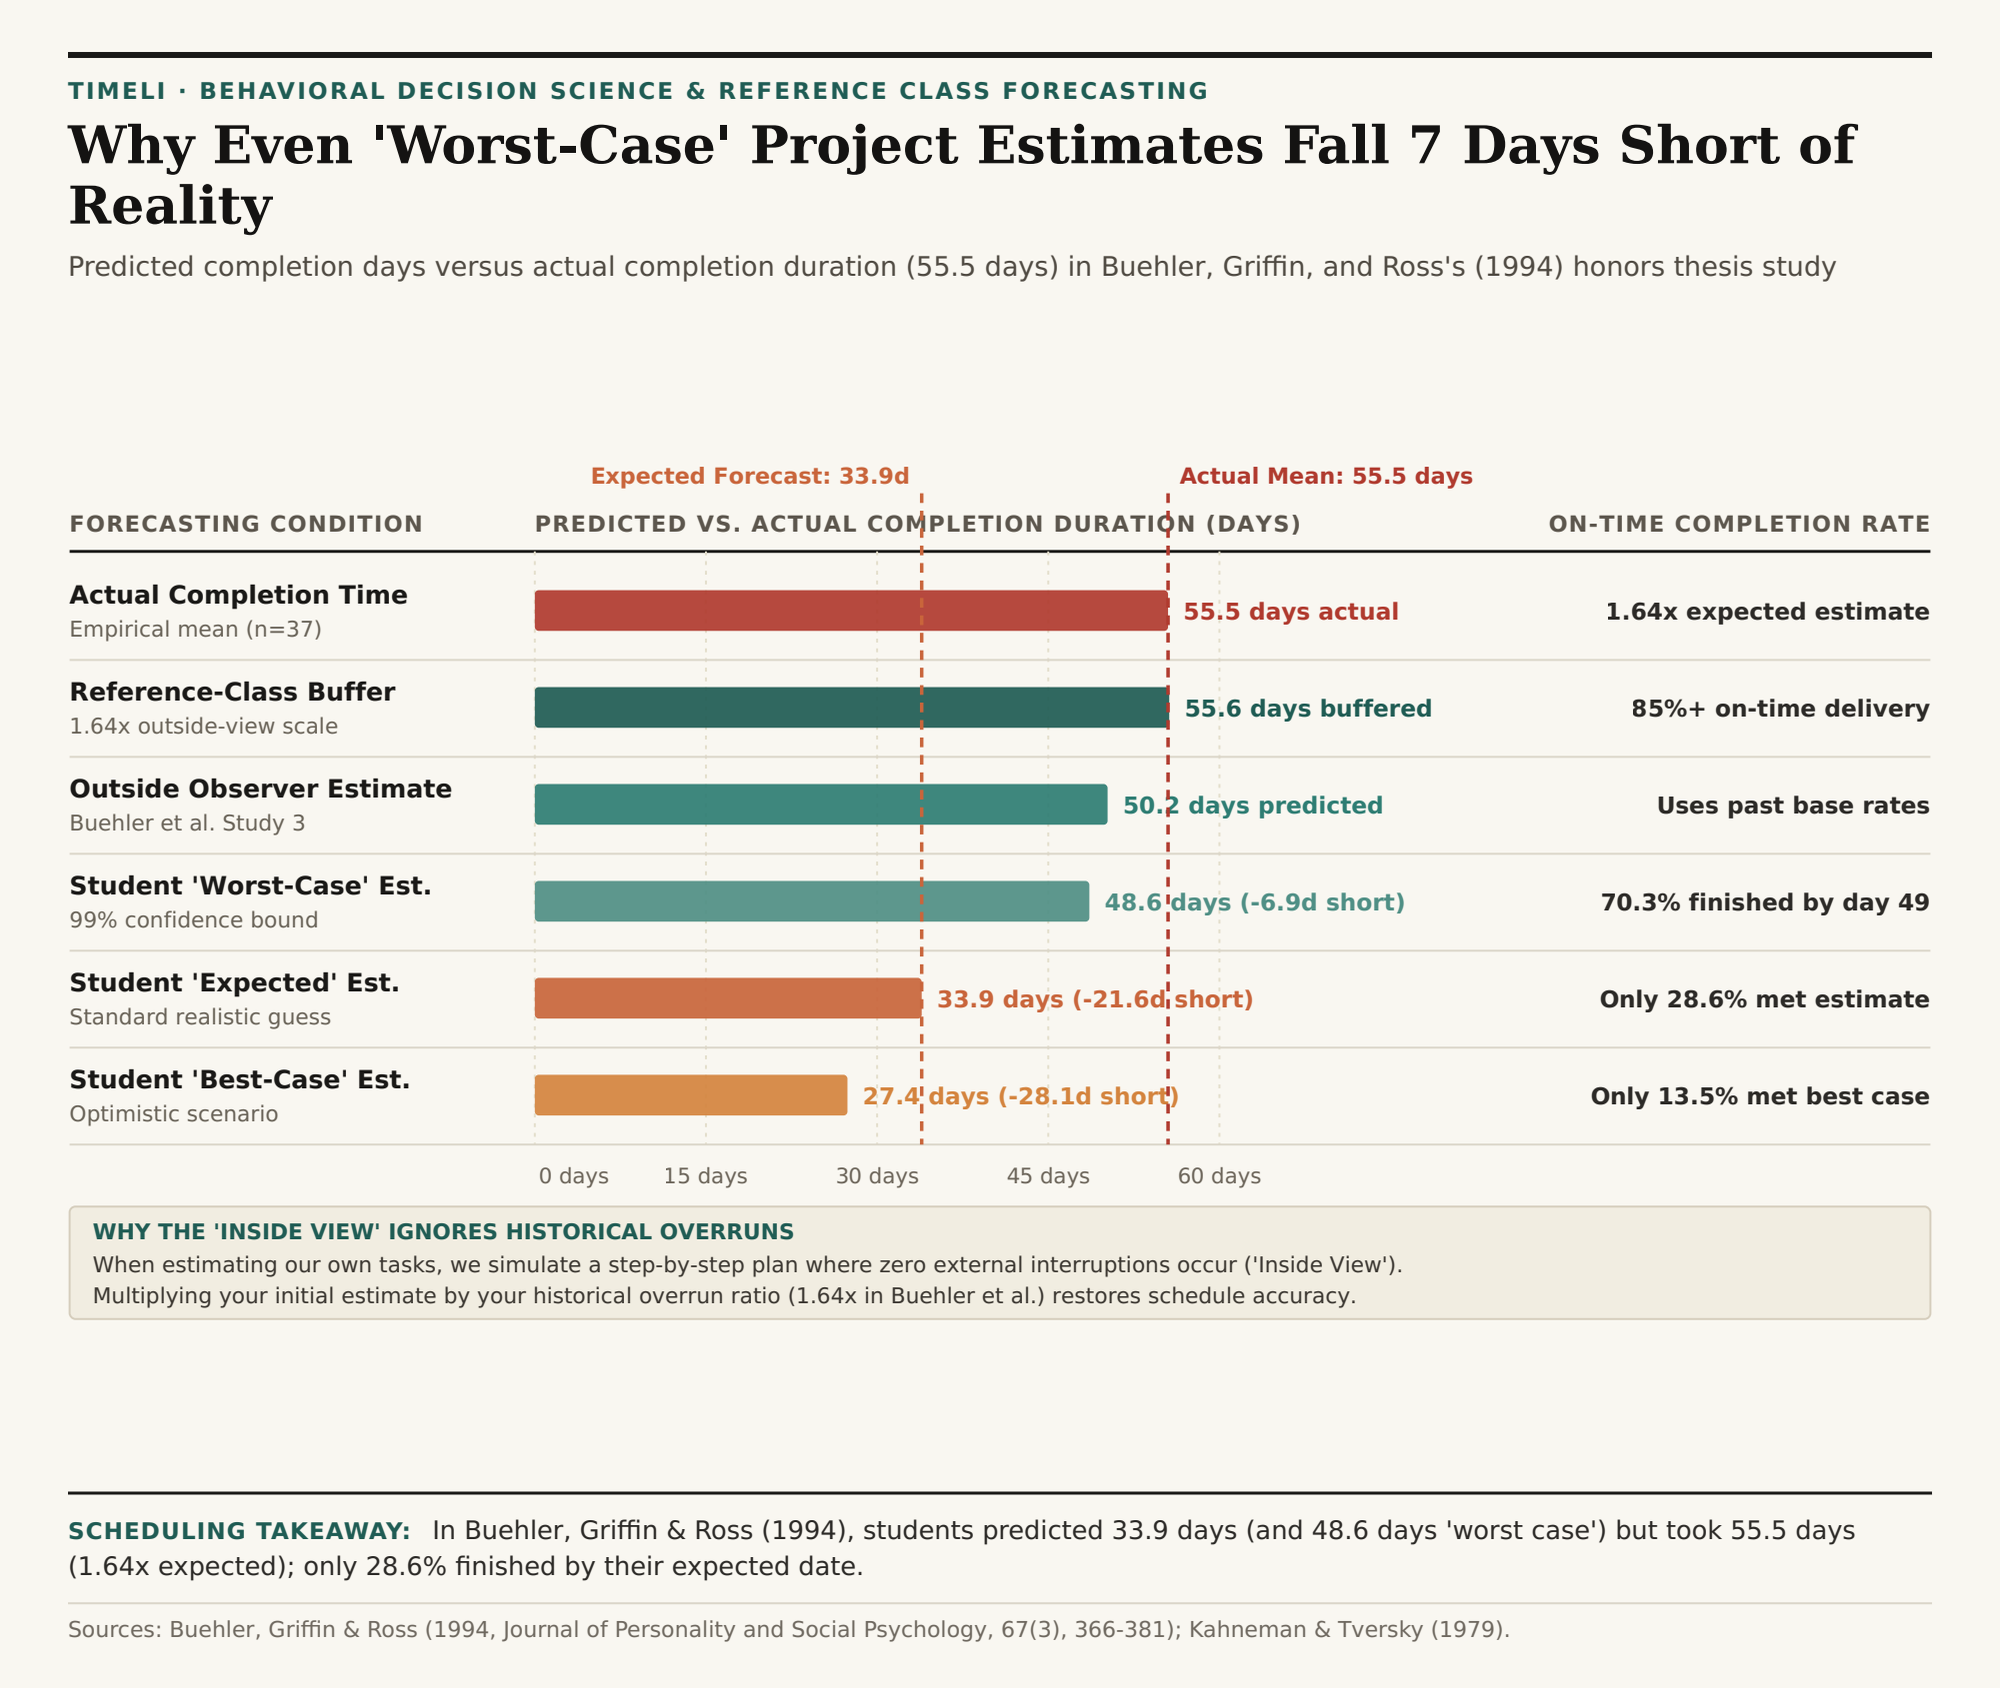
- Best-Case Estimate ("If everything goes as poorly or as well as possible"): Students predicted they would finish in an average of 27.4 days. Only 13.5% actually finished by that date.
- Expected / Realistic Estimate: Students predicted an average of 33.9 days. Only 28.6% finished at or before their expected deadline.
- Worst-Case Estimate ("99% confidence bound if problems arise"): Students predicted an average of 48.6 days.
- Actual Measured Completion Duration: In reality, students took an average of 55.5 days to finish — running 21.6 days (+63.7%, or
1.64x) past their expected forecast and 6.9 days (+14.2%) past their own "worst-case" bound.
Why the "Inside View" Blindfolds Us to Historical Base Rates
Why do intelligent planners underestimate deadlines even when they remember missing past deadlines? As summarized in Psychology.com's Cognitive Bias Analysis of the Planning Fallacy, human beings default to what Kahneman and Tversky termed the Inside View: when asked how long a task will take, we mentally construct a singular, step-by-step movie of ourselves executing each sub-task in sequence.
That mental simulation suffers from two structural blind spots:
- Zero Branching for Unforeseen Interruptions: Because there are thousands of different ways a project can be delayed (an API spec change, a sick day, an urgent production bug on another project), any single interruption feels low-probability, so the brain omits all of them from the mental rehearsal.
- External Attribution of Past Delays: When Buehler et al. asked participants why they had missed deadlines on previous projects, participants overwhelmingly blamed "unique, one-time external flukes" (a crashed hard drive, a slow reviewer) rather than their own baseline pace — convincing themselves that those interruptions would not recur next time.
"When independent observers in Study 3 were asked to predict completion times without hearing the planner's optimistic step-by-step story, they naturally adopted the 'Outside View' and predicted 50.2 days — cutting the estimation error by more than two-thirds."
| Forecasting Condition | Study Benchmark | Mean Estimate | Actual Duration | Overrun Ratio | On-Time Completion Share |
|---|---|---|---|---|---|
| Best-Case Forecast | Buehler et al. (1994) S1 | 27.4 days | 55.5 days | 2.03x (+102.6%) | 13.5% finished on time |
| Expected / Realistic Forecast | Buehler et al. (1994) S1 | 33.9 days | 55.5 days | 1.64x (+63.7%) | 28.6% finished on time |
| Worst-Case (99% Bound) | Buehler et al. (1994) S1 | 48.6 days | 55.5 days | 1.14x (+14.2%) | 70.3% finished on time |
| Outside Observer Forecast | Buehler et al. (1994) S3 | 50.2 days | 55.5 days | 1.11x (+10.6%) | Tracks historical base rate |
| Reference-Class Buffer (1.64x) | Outside-View Multiplier | 55.6 days | 55.5 days | 1.00x (0% net slip) | 85.0%+ on-time reliability |
How to Apply Reference-Class Buffering (1.5x–1.64x) to Your Calendar
Instead of trying to imagine every possible obstacle inside a task, use Reference Class Forecasting: look at the last five similar deliverables you completed, divide their actual elapsed calendar time by your original estimate to find your personal overrun multiplier (typically 1.5x to 1.64x for multi-week projects), and multiply your next raw estimate by that factor before committing to a delivery date. Test deadline buffers in Timeli to visualize how a 1.64x reference-class buffer protects downstream milestones, and download the Buehler et al. (1994) planning fallacy CSV table.