
What Is the Urban Heat Island Effect, and Why Are Cities Up to 5 Degrees Warmer at Night Than Rural Areas?
Most people assume the urban heat island (UHI) effect peaks at 2:00 PM on a blazing summer afternoon, when dark parking lots shimmer in the sun. While exposed asphalt and dark roofs do reach surface temperatures 50°F to 90°F (27°C to 50°C) hotter than the air at midday, meteorologists distinguish between the surface heat island and the canopy-layer atmospheric heat island—the air temperature measured two meters above the ground where people actually walk and sleep. According to the U.S. Environmental Protection Agency (EPA), U.S. cities average 1°F to 7°F (0.6°C to 3.9°C) warmer than outlying rural areas during the day, but maintain a persistent 2°F to 5°F (1.1°C to 2.8°C) nighttime elevation—with calm, clear summer nights regularly producing canopy air anomalies of 7°F to 10°F+ (4°C to 5.5°C+) in dense downtown cores.
In fact, as documented in Chapter 1 of the EPA Compendium of Urban Heat Island Strategies, the atmospheric temperature gap between a city center and its surrounding countryside typically reaches its daily maximum three to five hours after sunset. To see how urban station siting and overnight minimum temperatures (Tmin) diverge from historical baselines at your local airport, you can Compare daily station temperature anomalies in Eranorms across decades of NOAA ASOS observations.
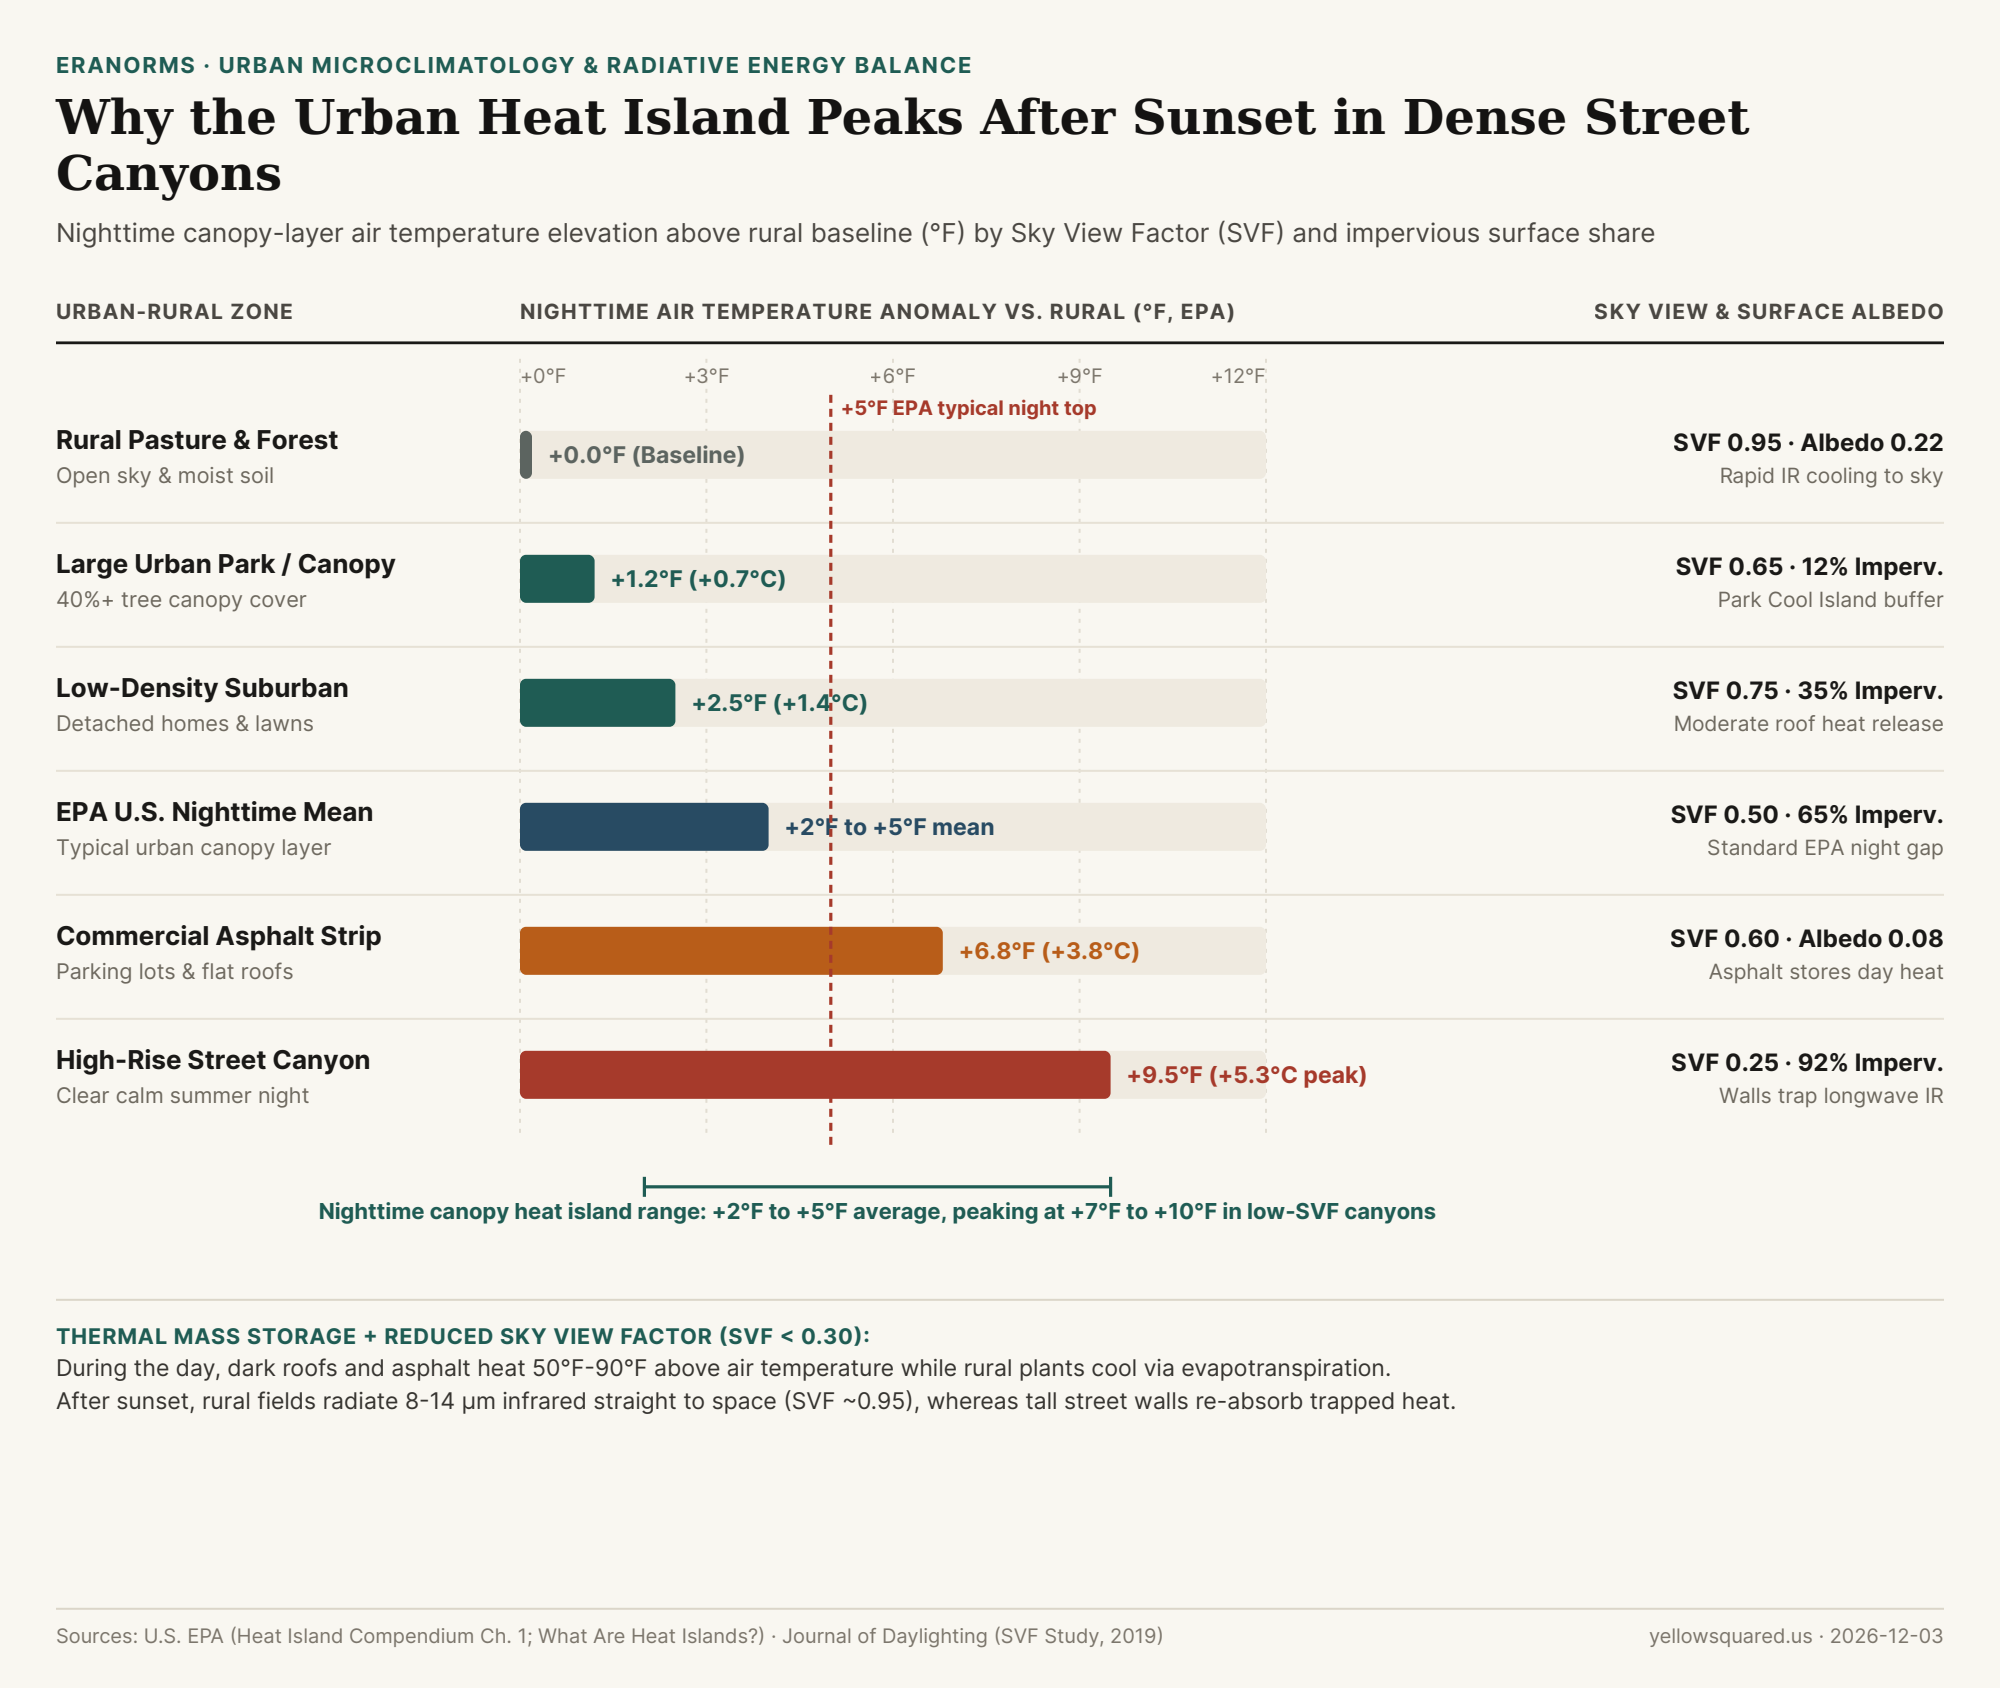
The Surface Energy Balance: Why Cities Refuse to Cool Down After Sunset
Every landscape obeys the surface energy balance equation: net incoming radiation (Q*) plus anthropogenic waste heat (Q_F) must equal sensible convective heating of the air (Q_H), latent evaporative cooling (Q_E), and conductive heat storage into the ground (ΔQ_S). Cities alter all four terms simultaneously:
- Low Albedo & Massive Conductive Thermal Storage (
ΔQ_S): Fresh asphalt has a solar reflectance (albedo) of just0.05(absorbing95%of incoming sunlight), while aged asphalt and dark roofing membranes sit between0.08 and 0.15. Because concrete, brick, and stone have high volumetric heat capacity and thermal conductivity, urban infrastructure acts like a giant masonry battery—soaking up megajoules of solar energy all afternoon and releasing it upward as sensible heat (Q_H) throughout the night. - Shutting Off Evapotranspirative Air Conditioning (
Q_E → Q_H): In a rural forest or irrigated pasture, trees and soil moisture use incoming solar energy to evaporate water (2,450 joules per gramof water vaporized), keeping leaf surfaces cool via latent heat flux (Q_E). When impervious roofs and streets cover65% to 92%of a downtown watershed, rainfall is shunted into storm drains, forcing nearly all absorbed solar energy into direct air heating (Q_H). - Sky View Factor (
SVF) Trapping inside Urban Street Canyons: As quantified in microclimate studies of Sky View Factor in high-rise urban street canyons, radiative cooling at night depends on how much of the cold upper hemisphere (0.0 to 1.0) a surface can "see." An open rural field hasSVF ≈ 0.95, allowing ground surfaces to radiate longwave thermal infrared (8–14 µm) straight through the atmospheric window into space. In a narrow downtown canyon flanked by high-rise buildings (SVF < 0.30), over70%of the upward hemisphere is blocked by warm neighboring walls that intercept and re-radiate infrared energy back onto the street.
"A rural meadow with a 0.95 Sky View Factor radiates its daytime heat straight into the cold night sky after sunset; a downtown street canyon with a 0.25 Sky View Factor bounces 8-to-14-micrometer infrared radiation back and forth between facing concrete walls until dawn."
Comparing Nighttime Warming Across Six Rural-to-Urban Microclimates
Because longwave radiative cooling is strongest when skies are cloud-free and winds are calm (< 5 mph, preventing turbulent mixing of the nocturnal boundary layer), the intra-urban temperature gradient across a single metropolitan area often spans 8°F to 10°F on summer nights:
| Land-Cover Microclimate | Sky View Factor (SVF) | Impervious Share | Surface Albedo | Daytime Air Delta | Nighttime Air Delta |
|---|---|---|---|---|---|
| Rural Pasture & Forest Baseline | 0.95 |
~2% |
0.20 – 0.25 |
+0.0°F (Baseline) |
+0.0°F (Baseline) |
Large Urban Park (40%+ Canopy) |
0.65 |
~12% |
0.18 |
+0.5°F |
+1.2°F (Park Cool Island) |
| Low-Density Suburban Neighborhood | 0.75 |
~35% |
0.16 |
+1.8°F |
+2.5°F |
| EPA U.S. City Average (Canopy Layer) | 0.50 |
~65% |
0.12 |
+1°F to +7°F |
+2°F to +5°F |
| Commercial Asphalt & Flat-Roof Strip | 0.60 |
~85% |
0.08 |
+6.5°F |
+6.8°F |
| High-Rise Street Canyon (Calm Night) | 0.25 (<0.30) |
~92% |
0.10 |
+5.2°F (Shaded) |
+9.5°F (Peak IR trap) |
Why High Overnight Low Temperatures (Tmin) Drive Heat-Wave Mortality
Notice a subtle paradox in the table above: during the middle of the day, a deep high-rise street canyon (+5.2°F) can actually feel slightly cooler than an unshaded suburban shopping-mall parking lot (+6.5°F) because tall towers cast deep shadows on the sidewalk. At night, however, that same street canyon becomes the hottest zone in the metropolitan region (+9.5°F) because its low Sky View Factor (0.25) blocks radiative heat escape while air-conditioning condensers pump anthropogenic waste heat (Q_F) into the stagnant canyon air. Public health epidemiologists emphasize that elevated overnight minimums (Tmin > 75°F / 24°C) prevent human cardiovascular recovery during multi-day heat waves. To track how daily minimum temperatures (Tmin) and maximum temperatures (Tmax) behave against 30-year climate normals at your nearest station, Compare daily station temperature anomalies in Eranorms.