
Why Are Seasons Milder in the Southern Hemisphere Than the Northern Hemisphere?
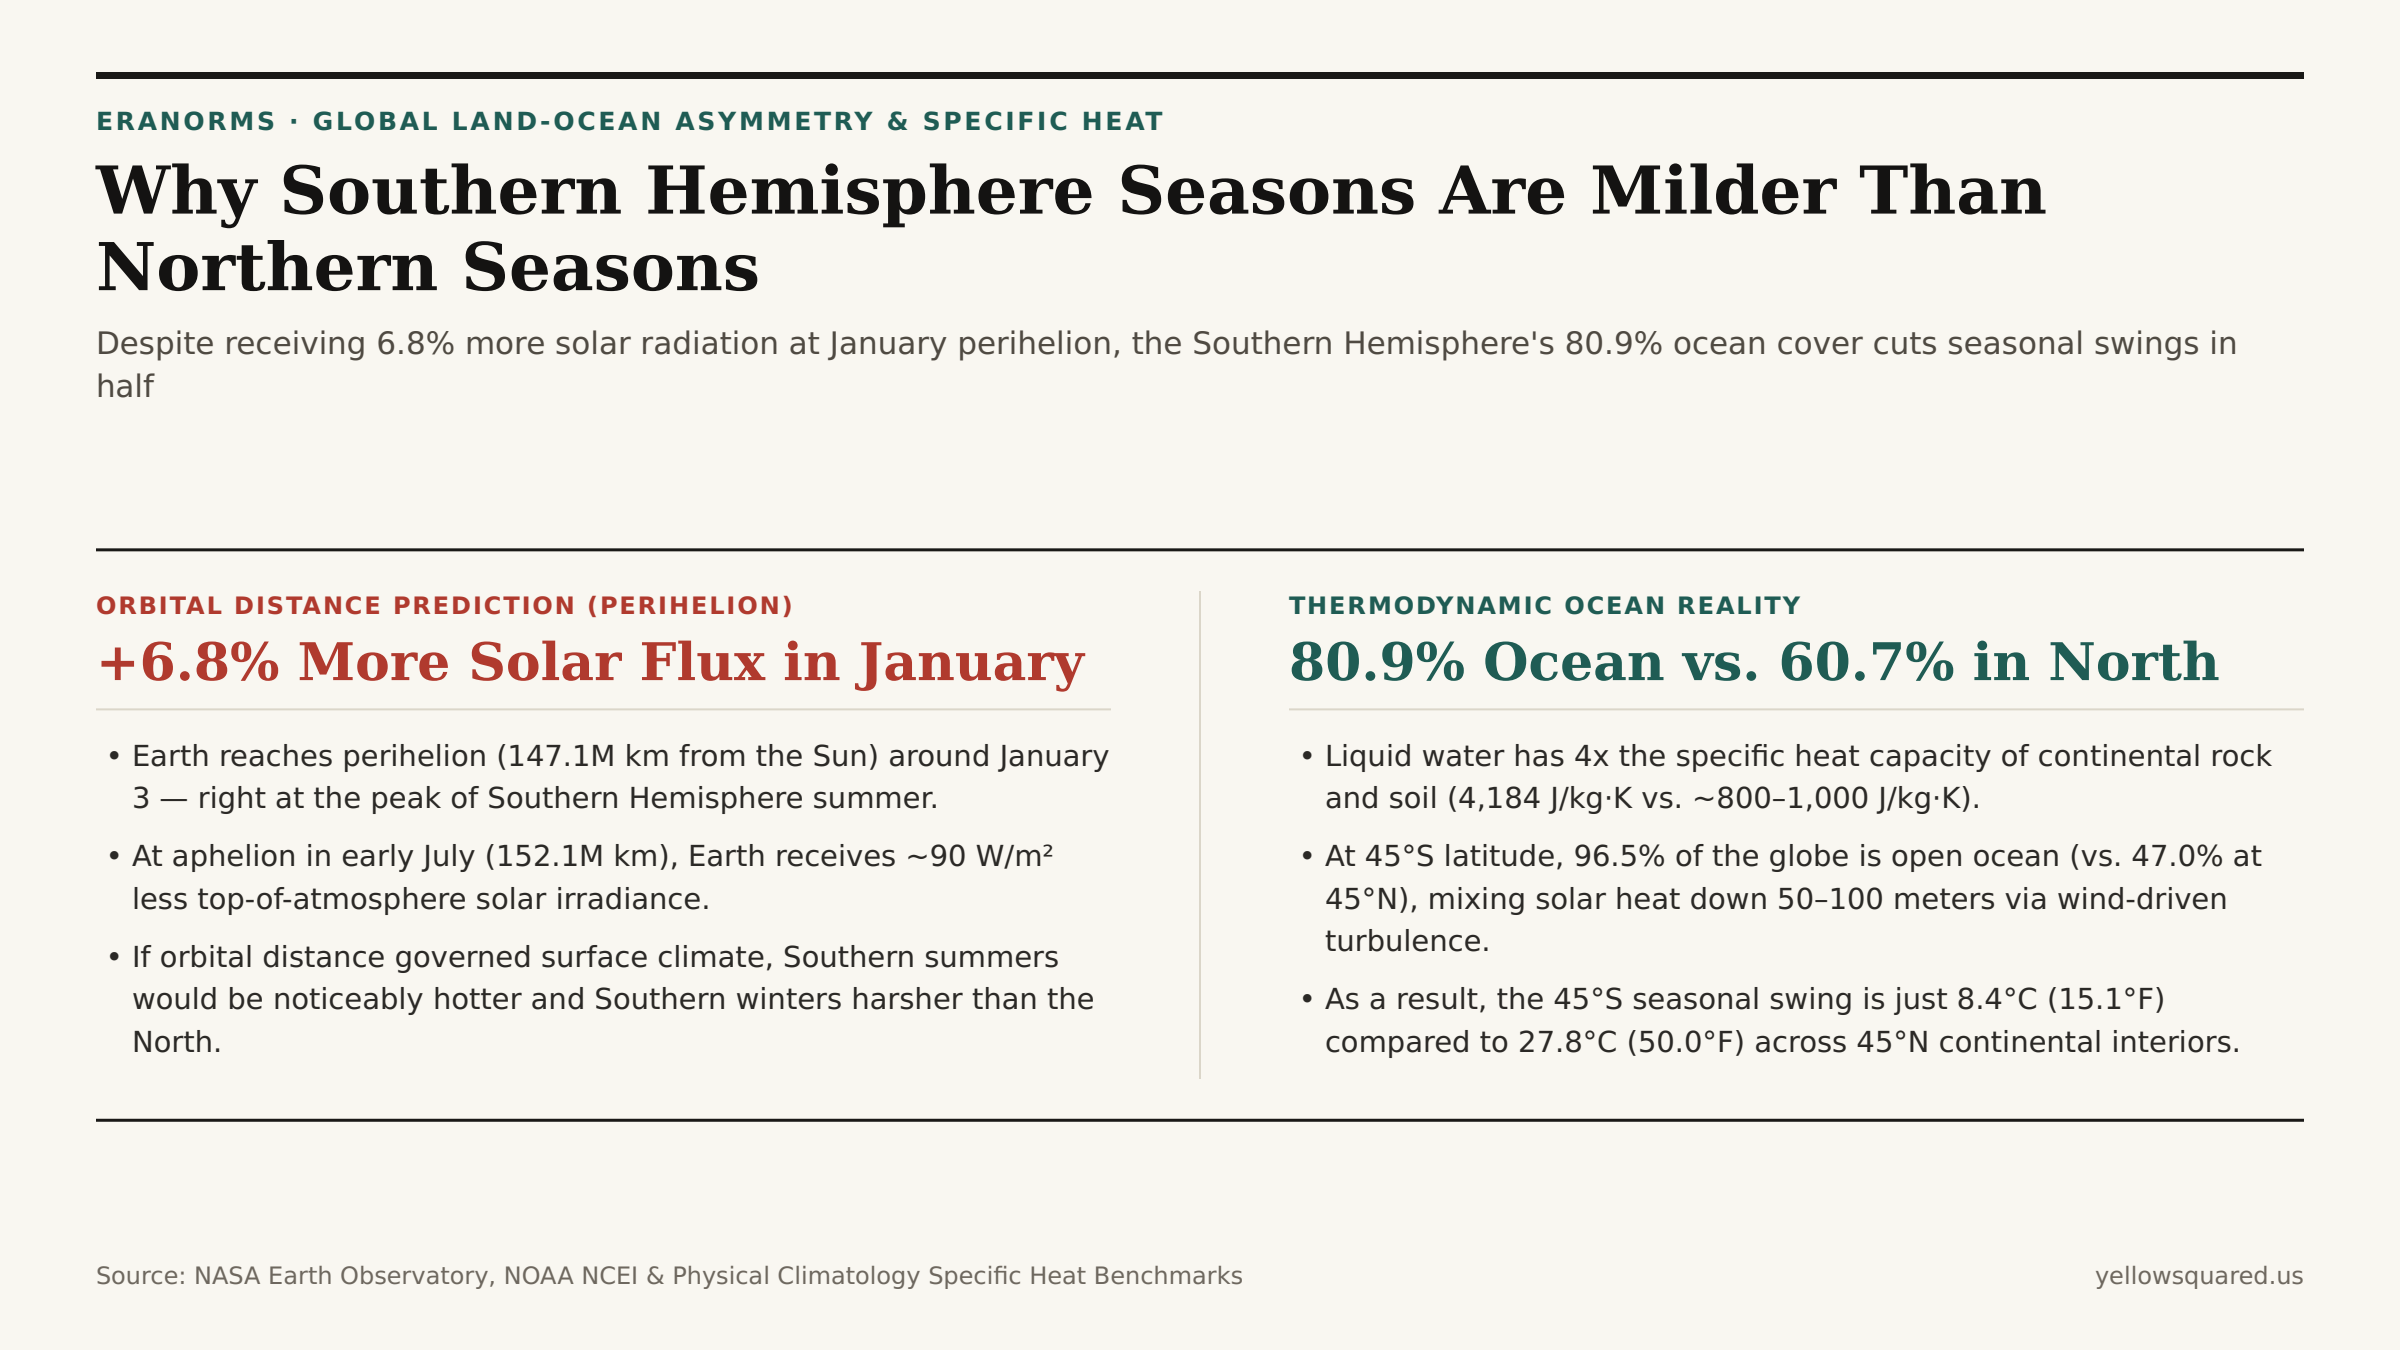
If Earth's distance from the Sun dictated the severity of the seasons, the Southern Hemisphere would suffer scorching summers and brutal winters. Because Earth travels in a slightly elliptical orbit, our planet reaches perihelion (its closest approach to the Sun, ~147.1 million km) around January 3 — right in the middle of the Southern Hemisphere's summer — and reaches aphelion (~152.1 million km) around July 4 during the Southern winter. As documented in NASA Orbital Insolation & Perihelion-Aphelion Benchmarks, Earth receives 6.8% more incoming solar radiation in January than in July (roughly 1,407 W/m² vs. 1,317 W/m² at the top of the atmosphere).
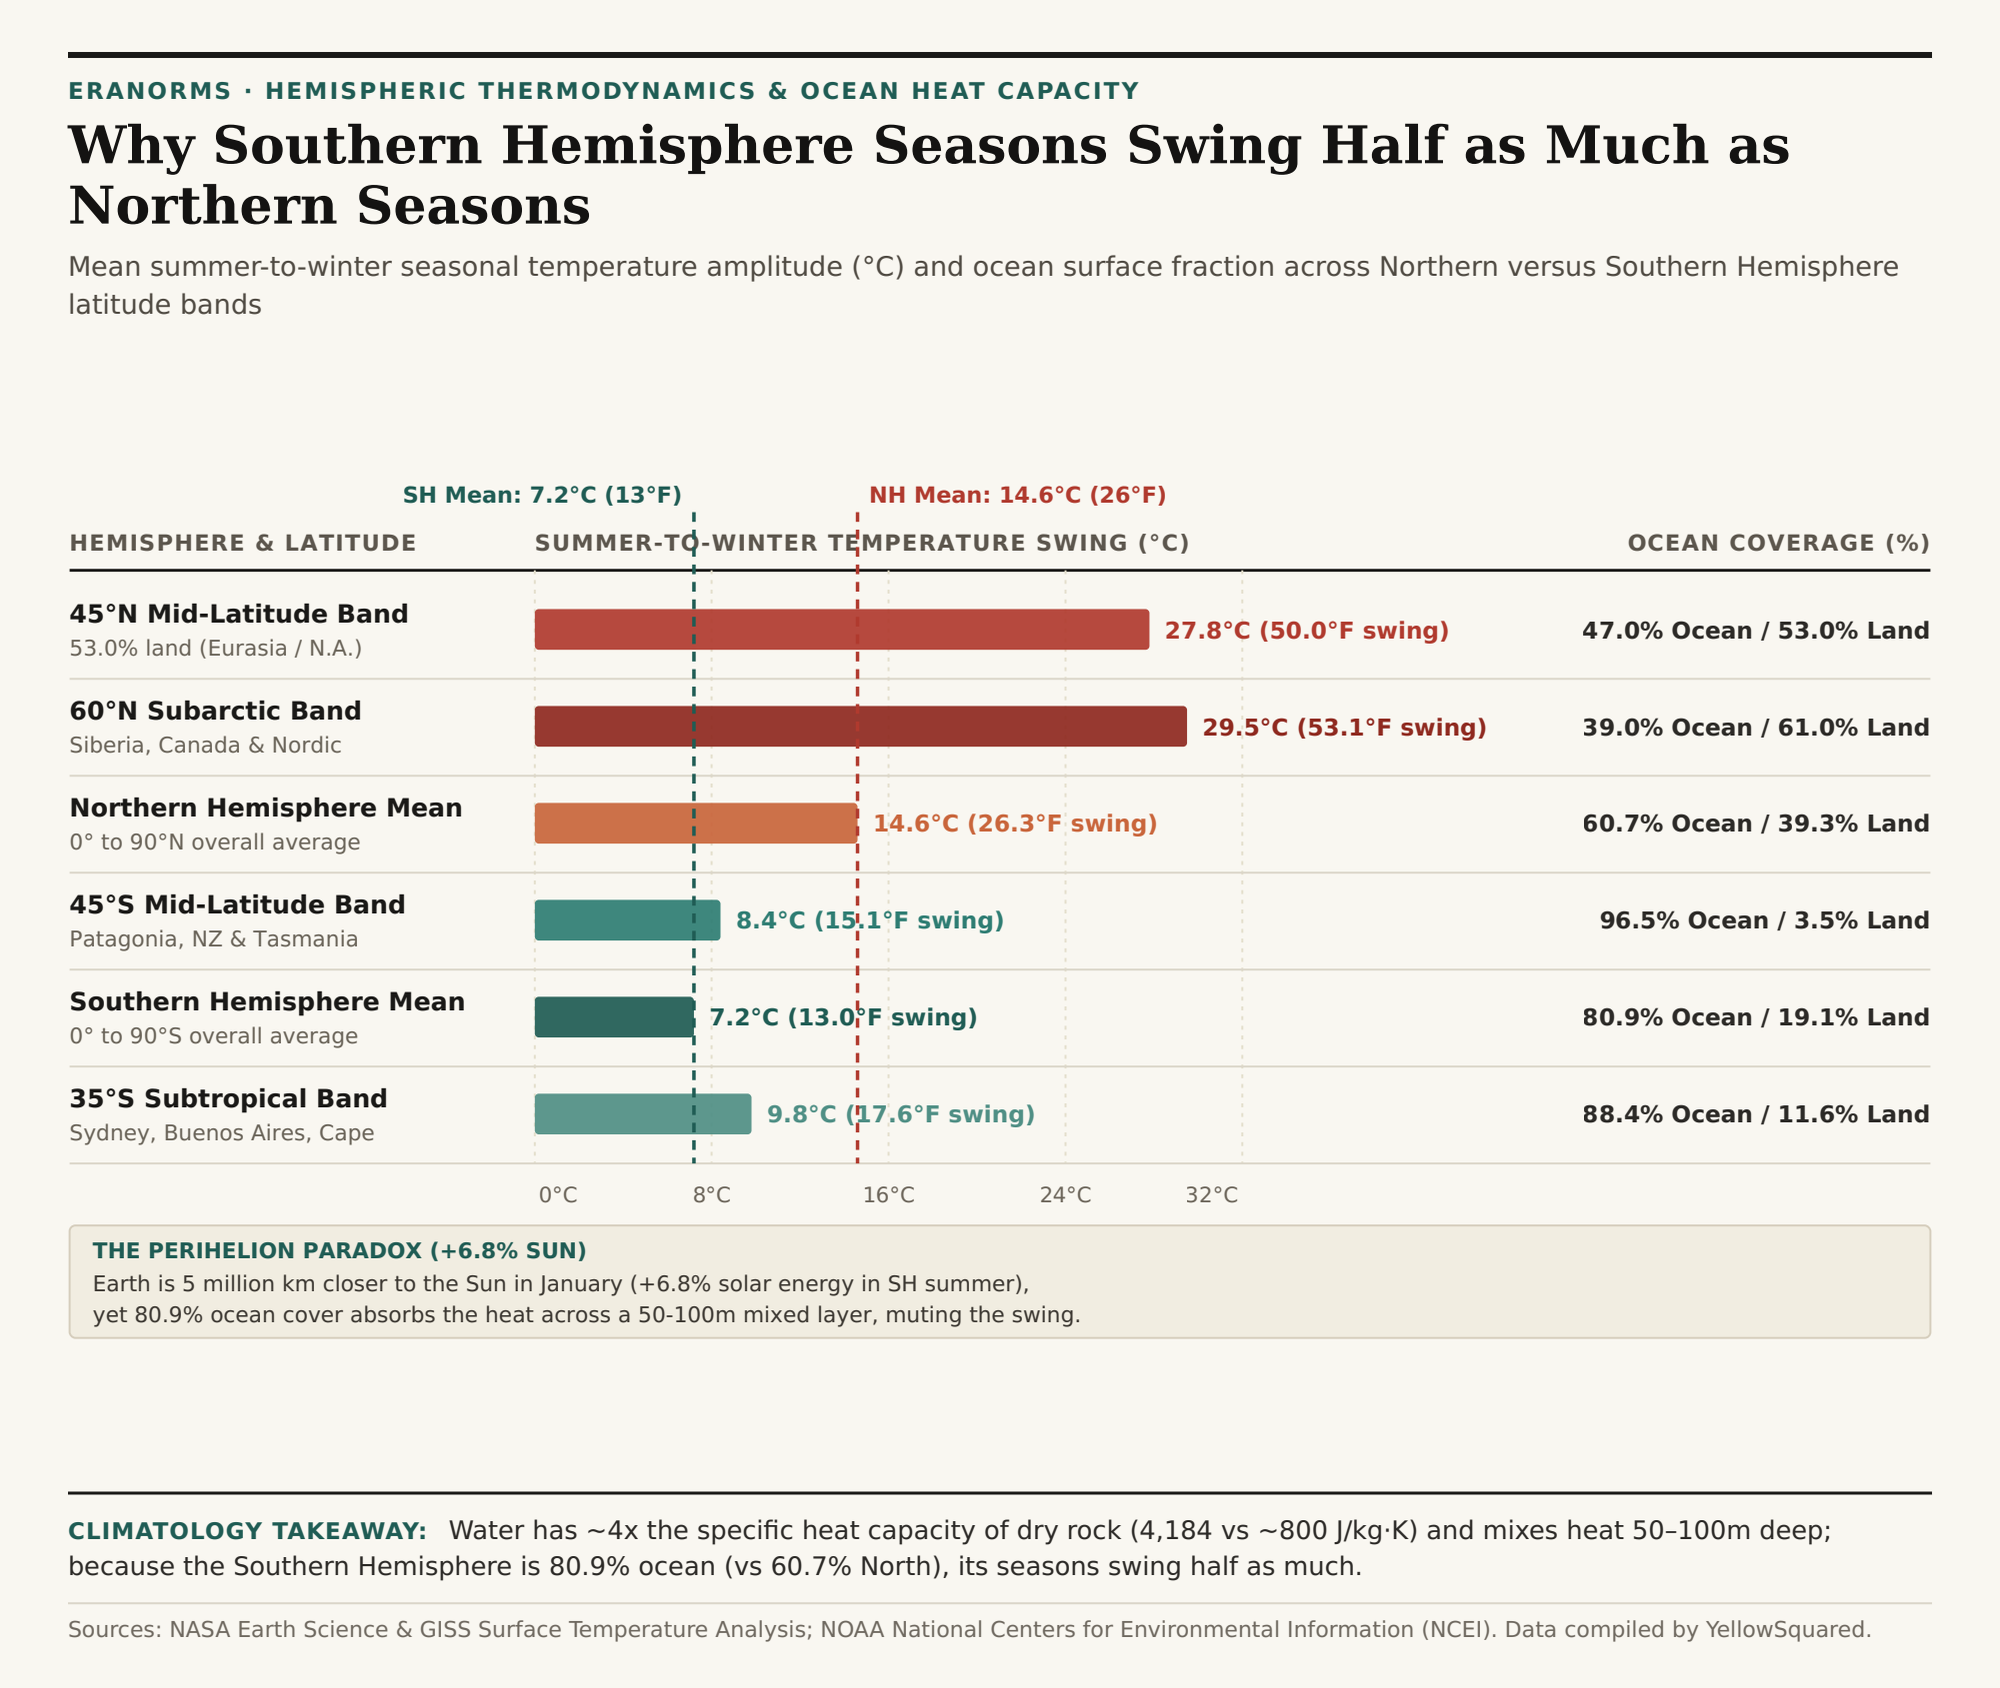
Yet historical thermometer records show the exact opposite outcome on the ground: averaged across the entire hemisphere, the Southern Hemisphere's mean summer-to-winter temperature swing is roughly 7.2°C (13.0°F), barely half the 14.6°C (26.3°F) seasonal swing of the Northern Hemisphere. At mid-latitudes (45°S vs. 45°N), the contrast is even more dramatic: 45°N continental cities swing by an average of 27.8°C (50.0°F) between January and July, while the 45°S band swings by just 8.4°C (15.1°F). To inspect multi-decade seasonal temperature curves for any latitude on Earth, Compare historical climate norms in Eranorms.
The 80.9% vs. 60.7% Land-Ocean Asymmetry
The physical mechanism overriding Earth's orbital eccentricity is the lopsided distribution of continents and oceans across the equator, combined with the thermodynamic properties of liquid water and atmospheric water vapor analyzed in NASA Earth Science's Atmospheric Water Vapor & Thermal Balance Research and NOAA's Global State of the Climate Assessment:
- Surface Coverage Asymmetry: The Southern Hemisphere is 80.9% ocean and only 19.1% land, whereas the Northern Hemisphere is 60.7% ocean and 39.3% land. In the temperate mid-latitude belt between 40° and 50° latitude — where seasonal jet-stream shifts are most pronounced — the Southern Hemisphere is 96.5% open ocean (interrupted only by southern Patagonia, Tasmania, and New Zealand's South Island), while 45°N is 53.0% landmass across North America and Eurasia.
- 4x Specific Heat Capacity of Water: Liquid water has a specific heat capacity of 4,184 J/(kg·K), roughly four to five times higher than dry continental rock, sand, or soil (~800 to 1,000 J/(kg·K)). It takes four times as much thermal energy to raise the temperature of a kilogram of seawater by 1°C as it does an equal mass of granite.
- 50–100 Meter Turbulent Mixing vs. 2 Meter Soil Conduction: Over land, incoming summer sunlight is absorbed by a paper-thin surface layer and conducts downward through solid soil by less than 1 to 2 meters. Over the Southern Ocean, solar radiation penetrates tens of meters into translucent water, and relentless westerly winds mechanically stir that heat across an ocean mixed layer 50 to 100 meters deep — giving the ocean column 30 to 100 times the effective seasonal thermal inertia of a continent.
Why Kepler's Second Law Also Shortens Southern Summer by 5 Days
There is a second orbital quirk that helps offset the +6.8% perihelion solar bonus. According to Kepler's Second Law of Planetary Motion (conservation of angular momentum), a planet moves faster along its orbit when it is closer to the Sun (perihelion in January) and slower when it is farther away (aphelion in July). As noted in Climatology Insolation & Orbital Distribution Records, the Southern Hemisphere astronomical summer (from the September equinox to the March equinox) lasts 178.7 days, making it roughly 5 days shorter than the Northern Hemisphere astronomical summer (186.4 days from March to September).
"Because Earth races fastest through the perihelion arc of its orbit in December and January, the Southern Hemisphere's higher peak solar intensity is counterbalanced by a shorter summer duration and an 80.9% maritime thermal buffer."
| Latitude Band / Metric | Hemisphere | Ocean Cover | Land Cover | Seasonal Swing (°C) | Seasonal Swing (°F) | Primary Physical Driver |
|---|---|---|---|---|---|---|
| Southern Hemisphere (0°–90°S) | Southern | 80.9% | 19.1% | 7.2°C | 13.0°F | High ocean fraction & 4,184 J/kg·K specific heat |
| Northern Hemisphere (0°–90°N) | Northern | 60.7% | 39.3% | 14.6°C | 26.3°F | Large Eurasian & North American continental interiors |
| 45°S Mid-Latitude Band | Southern | 96.5% | 3.5% | 8.4°C | 15.1°F | Unbroken Southern Ocean 50–100m turbulent mixed layer |
| 45°N Mid-Latitude Band | Northern | 47.0% | 53.0% | 27.8°C | 50.0°F | Shallow soil heat conduction (<2m) drives extremes |
| Perihelion vs. Aphelion Flux | Global Orbit | N/A | N/A | +6.8% Jan Flux | 1,407 vs. 1,317 W/m² | 5.0M km closer in Jan, offset by 5-day shorter SH summer |
Comparing Maritime vs. Continental Normals in Eranorms
Whether you are comparing Hobart, Tasmania (42.9°S, where January highs average 21.6°C and July highs average 11.7°C) against Minneapolis, Minnesota (45.0°N, where July highs average 28.5°C and January lows plunge to -13.6°C), understanding the ratio of upwind ocean fetch to continental landmass explains why latitude alone never predicts seasonal extremes. To explore 30-year monthly temperature, humidity, and precipitation normals across both hemispheres, Compare historical climate norms in Eranorms and download the hemispheric climate comparison CSV.