
Why Did 5% to 7% of Babies Share the #1 Name a Century Ago—While Today's Top Name Reaches Less Than 1%?
If you grew up in the United States during the 1950s, 1960s, or 1970s, every elementary school classroom had two or three kids with the exact same first name—Mary, Linda, Jennifer, James, John, or Michael—forced to go by their last initial ("Jennifer S." vs. "Jennifer M."). Today, expectant parents agonize over whether choosing a top-10 name like Olivia, Emma, Liam, or Noah will doom their child to that same classroom pileup. Yet when you inspect the underlying birth-certificate totals from the U.S. Social Security Administration (SSA), a startling statistical shift jumps off the page: a #1 baby name today is roughly six to eight times less concentrated than a #1 name was a century ago. As documented in the Wikipedia U.S. Female Birth Name Registry, Statista's 1925–2024 SSA demographic analysis, BabyCenter's historical archive, and Row Zero's longitudinal SSA dataset, the share of American baby girls given the #1 name plunged from 7.24% in 1880 (and 5.48% during the 1947 Linda boom) to just 0.8% for #1 Olivia in 2024.
Why did English-speaking parents once funnel a quarter of the entire population into three or four biblical and royal names, how did Jennifer rocket from 38 births in 1938 to 63,600 births in 1972, and why has the modern baby-name pool fractured into 31,904 distinct names? Here is the complete demographic breakdown.
1. The 74-Year Reign of Mary and the 1947 Linda Super-Spike
In early modern England (1538–1700), parish baptismal registers studied by historians show that just three female names—Mary, Elizabeth, and Anne—and three male names—John, William, and Thomas—routinely accounted for more than 50% of all christenings, because children were almost universally named after godparents, parents, or patron saints. That high-concentration norm carried directly into the first seven decades of the U.S. Social Security Administration database (BabyCenter / SSA; SSA Top 5 Names in the Last 100 Years):
- Mary (#1 for 74 Years) & John (#1 for 43 Years): From the start of the SSA series in 1880 through 1946 (67 consecutive years) and again from 1953 through 1961 (another 9 years), Mary was the #1 girl's name in America—capturing
7.24%of recorded female births in 1880 and totaling 2.9 million girls between 1925 and 2024 (Statista). On the boys' side, John held #1 for 43 straight years (1880–1923), followed by Robert, James (4.5 million boys between 1925 and 2024), and Michael (which held #1 44 times over the last century). - 1947 — Nearly 100,000 Lindas in a Single Year: As Row Zero's SSA audit highlights, the single highest-volume female name year in U.S. history occurred in 1947, right after singer Buddy Clark's hit recording of the song "Linda" (written by Jack Lawrence for the 5-year-old daughter of his entertainment lawyer, Lee Eastman—who grew up to be Linda McCartney!). In 1947 alone,
99,689baby girls (5.48%of all female births) were named Linda—nearly five times the ~20,000 births of today's #1 boy name, Liam! - 1970–1984 — The Jennifer Wave (
4.029%in 1974): As documented in Wikipedia's U.S. female birth name analysis, in 1938 only38babies in the entire United States were named Jennifer. Boosted by actress Jennifer Jones and the 1970 novel and film Love Story, Jennifer hit #1 for 15 straight years (1970–1984), peaking at63,600births in 1972 and4.029%of all female births in 1974—the last time in American history any girl's name crossed the 4% mark.
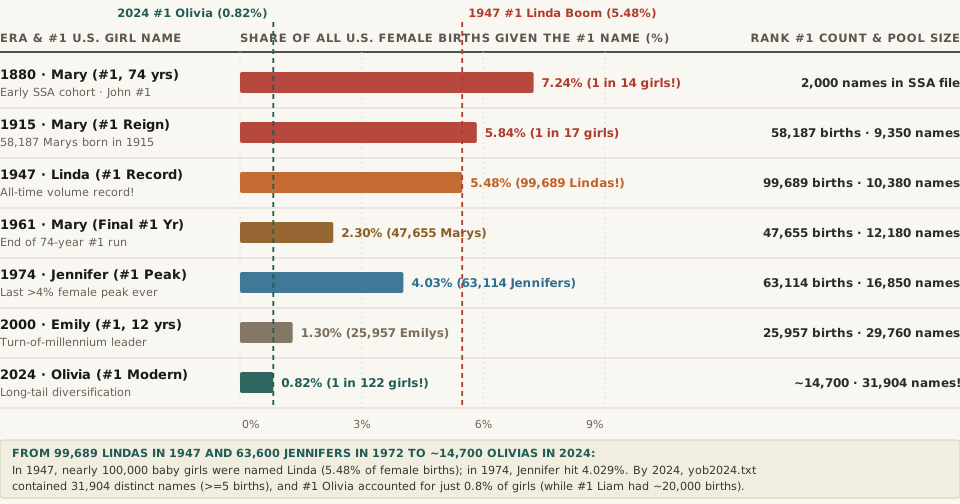
2. Why Top-Name Concentration Collapsed by 88% (From 7.2% to 0.8%)
Why did the #1 girl's name shrink from 5.8%–7.2% of births in the early 1900s to 2.3% in 1961 and just 0.8% in 2024 (Statista)? Sociologists and demographers point to three structural shifts:
- From Patrilineal/Religious Duty to Aesthetic Individualism: In Stanley Lieberson's A Matter of Taste (2000), the decline of strict kinship naming rules (naming the eldest son and daughter after their father, mother, or grandparents) freed parents to treat names as aesthetic expressions of individuality.
- The Reflexive "Top-10 Avoidance" Feedback Loop: Before the SSA began publishing annual baby-name rankings on the internet in the late 1990s, parents had no way of knowing that 63,000 other families were also choosing Jennifer or Linda that year until their child showed up for kindergarten. Today, because every parent checks the SSA Top 100 list before the baby is born, rising toward #1 immediately triggers "popularity avoidance" among a large share of parents—capping the ceiling of #1 names near
0.8%–1.1%. - Explosion of the Long Tail to
31,904Names & Orthographic Splitting: As verified in the 2024 national SSA zipfile (yob2024.txt), the number of distinct name-sex entries with at least 5 births has grown from2,000in 1880 to31,904in 2024—and the top 1,000 names on the SSA website now cover only about71%of U.S. births!
"Where the most popular female name of Mary accounted for 2.3 percent of female births in 1961, the most popular girls name in 2024 (Olivia) accounted for just 0.8 percent of girl names."
3. Complete Data Table: U.S. #1 Name Share & Pool Expansion (1880–2024)
The reproducible table below—matching the companion CSV (us-top-1-baby-name-share-of-births-1880-to-2024-mary-linda-jennifer-olivia-ssa.csv)—tracks the #1 female and male names, birth counts, percentage shares, and total distinct names across 144 years of U.S. SSA records:
| Benchmark Year | #1 Female Name | #1 Share of Girls (%) | #1 Female Births | #1 Male Name | Distinct SSA Names (≥5) |
Historical Milestone (Wikipedia / Statista) |
|---|---|---|---|---|---|---|
| 1880 | Mary | 7.24% |
7,065 (Partial cohort) |
John (~8.15%) |
2,000 |
1 in 14 girls named Mary; 1 in 12 boys named John |
| 1915 | Mary | 5.84% |
58,187 |
John | ~9,350 |
Birth registration expands; Mary & John dominate |
| 1947 | Linda | 5.48% |
99,689 (Record!) |
James (94,757) |
~10,380 |
All-time single-year U.S. female birth count record |
| 1961 | Mary | 2.30% |
47,655 |
Michael | ~12,180 |
Final year of Mary's 74-year reign at #1 |
| 1974 | Jennifer | 4.03% (4.029%) |
63,114 (63,600 in '72) |
Michael (67,578) |
~16,850 |
Last time in U.S. history a girl's name exceeded 4% |
| 2000 | Emily | 1.30% |
25,957 |
Jacob (34,484) |
~29,760 |
Internet rankings accelerate long-tail diversification |
| 2024 | Olivia | 0.82% (~0.8%) |
~14,700 |
Liam (~20,000) |
31,904 |
#1 girl name given to less than 1 in 120 baby girls! |
4. Three Essential SSA Data Limitations to Keep in Mind
When comparing 19th-century and 21st-century concentration figures in the SSA baby names database, keep three methodological limits in mind:
- Exact Spelling Separation Understates Phonetic Concentration: As Wikipedia notes, the SSA tabulates
SarahandSara,KatherineandCatherine, orSophiaandSofiaas completely separate names. In the 2000s and 2020s, part of the drop in top-1 share comes from parents splitting a single phonetic name across 4 or 5 spellings (such asJackson,Jaxon,Jaxson). - Pre-1937 SSN Application Bias: Because Social Security numbers were not issued until 1936 (and were not required on tax returns for children under age 5 until 1986), the 1880–1935 cohorts reflect people who survived to adulthood and applied for a card decades later—under-counting rare names and early childhood mortality.
- Suppression Under 5 Births (
<5): For privacy protection, any name given to fewer than 5 babies of the same sex in a year (<5) is excluded from the public national file, meaning the true tail of unique one-off names is even wider than the31,904published rows.
To see how any name's real classroom frequency (births per 10,000 babies) compares against its numerical rank from 1880 to today, Compare name popularity curves in Name Scout.