
Old Baby Names Can Return—Without a Universal 100-Year Clock
Violet appeared 113 times in the girls’ file for 1975. In 2025 it appeared 7,546 times and ranked thirteenth. Eloise rose from 38 recorded girls in 1975 to 4,251 in 2025. Names that once occupied a small corner of the list have become familiar again.
That revival is often described as a hundred-year naming cycle. The examples do show long declines followed by recoveries. They do not establish a clock that applies to every name, or tell us which currently uncommon names will return next.
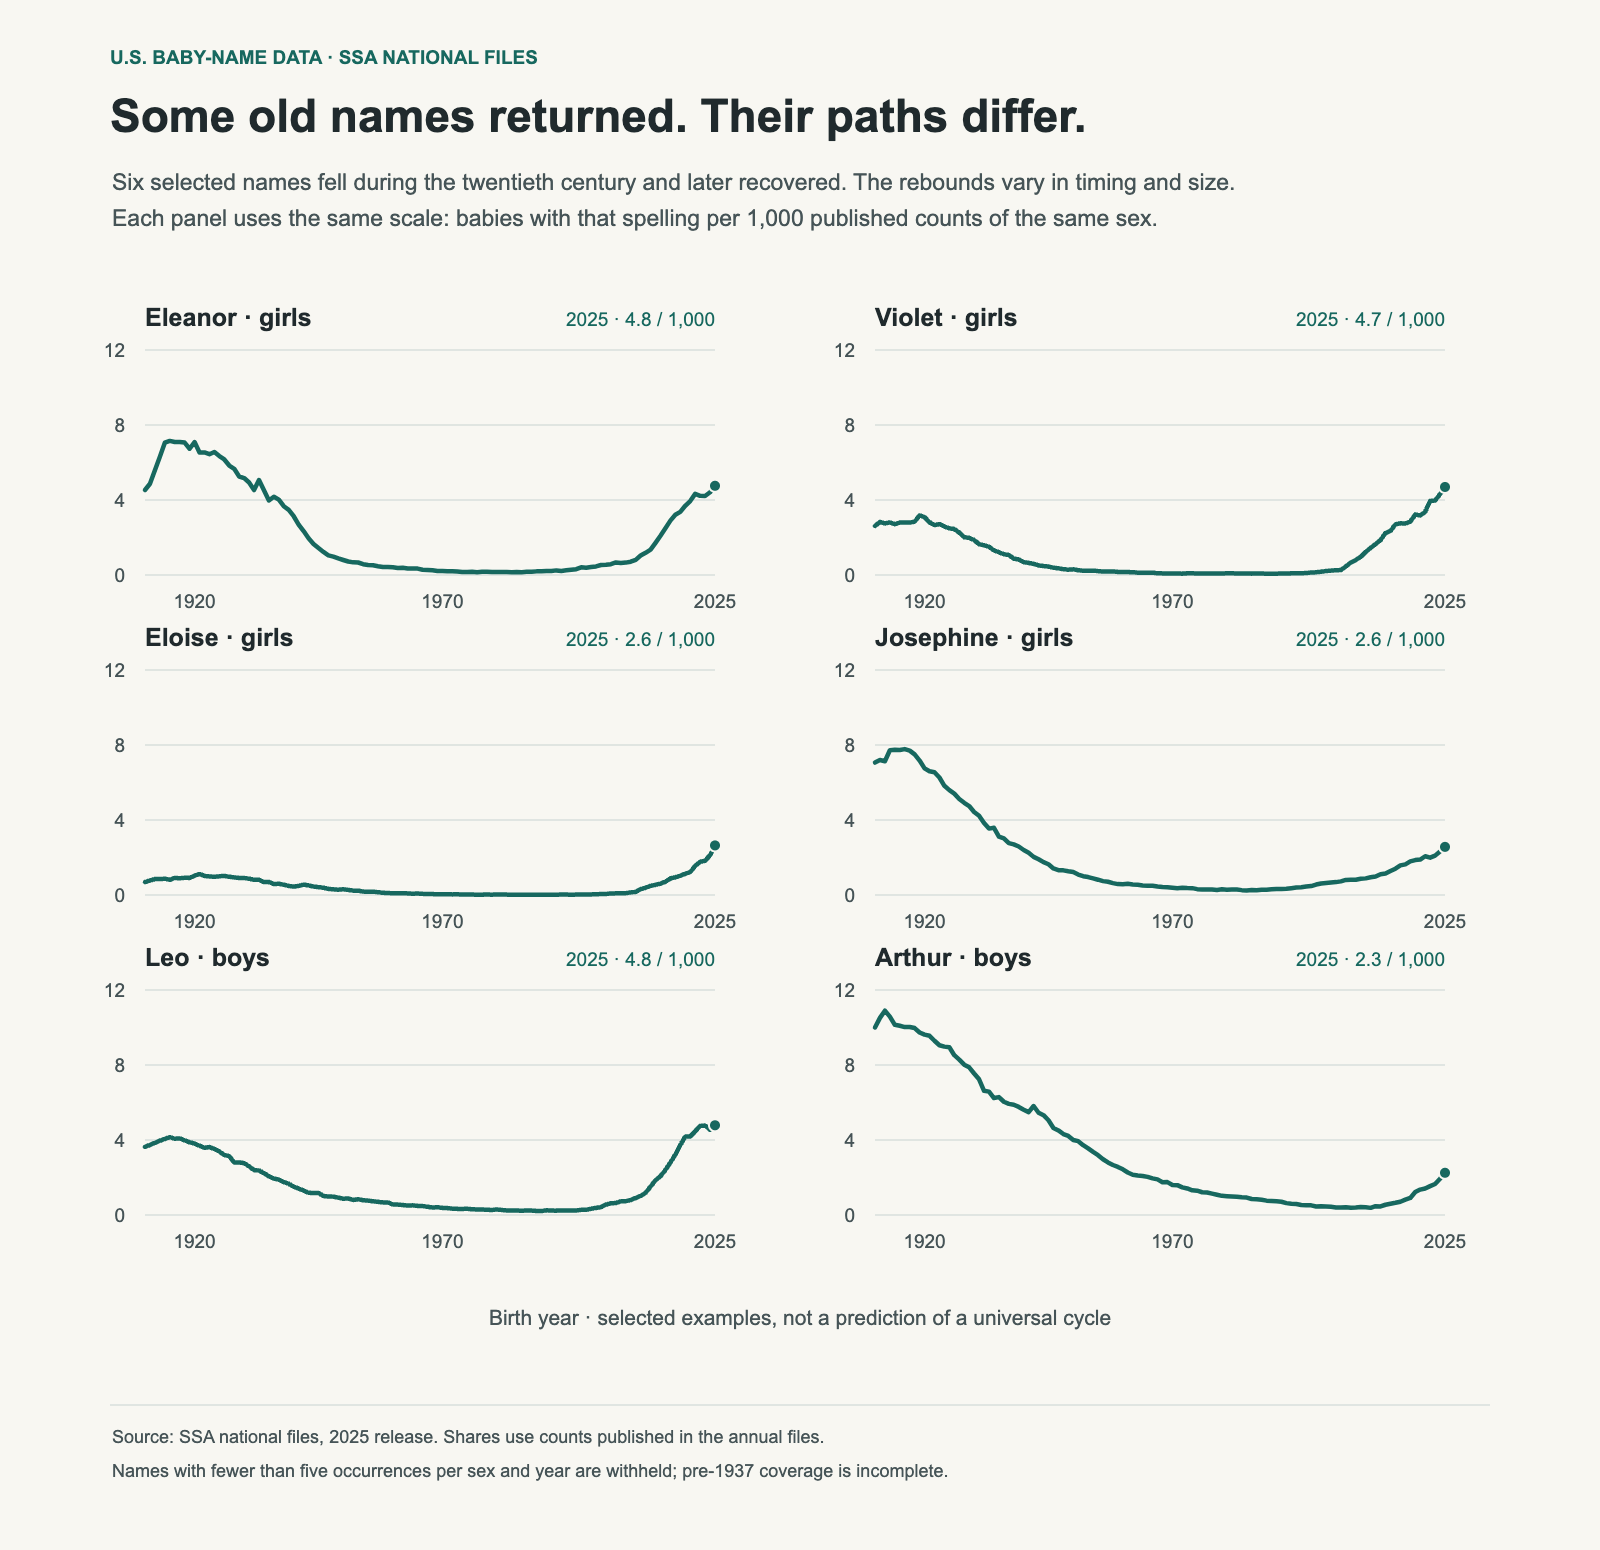
The recoveries differ in size
Violet and Leo have surpassed their 1920 counts. Eleanor’s 2025 count is still below its 1920 count, while Arthur has recovered only part of its earlier level. Josephine and Eloise provide two more distinct paths. Combining them into a single “vintage names are back” claim hides those differences.
| Name | 1920 count | 1975 count | 2025 count | 2025 rank |
|---|---|---|---|---|
| Eleanor | 8,497 | 234 | 7,649 | #12 |
| Violet | 3,694 | 113 | 7,546 | #13 |
| Eloise | 1,239 | 38 | 4,251 | #49 |
| Josephine | 8,093 | 456 | 4,126 | #53 |
| Leo | 4,054 | 516 | 8,173 | #19 |
| Arthur | 10,236 | 2,022 | 3,847 | #87 |
The 1975 column is a fixed comparison year, not a claim that every name hit its minimum then. In the 1950–2000 window, Violet’s smallest count is in 1972, Eleanor’s in 1974, Eloise’s in 1977, Leo’s in 1986, Josephine’s in 1985 and Arthur’s in 1999. Their low points were spread over decades.
Count recovery is not the same as share recovery
The total number of published names changes between years, so counts alone can mislead. Eleanor’s 8,497 girls in 1920 represented about 7.1 per 1,000 published female counts. Its 7,649 girls in 2025 represented about 4.8 per 1,000. Its count has approached the earlier level more closely than its share has.
The chart therefore uses shares within each year and sex. It also keeps a common scale rather than giving every name’s highest point a value of 100%. That lets you see both the shape of the revival and the size of each name’s presence.
Why a huge percentage increase can sound larger than it is
Eloise’s count is about 112 times its 1975 count. That is a large recovery, but it begins from just 38 occurrences. Its 2025 share remains about 2.6 per 1,000 published girls’ counts. A dramatic growth percentage and a modest population share can both be true.
For parents, the current count or share is usually more useful than a trough-to-now percentage. It tells you how common the name is now, rather than how far it has travelled from an unusually small starting point.
Why these curves cannot predict the next revival
These names were chosen because they show a recovery. That selection leaves out old names that stayed uncommon, declined further or followed a different path. A forecasting rule would have to include those cases, define what counts as a revival, and be checked against names that were not used to build the rule.
Generational associations are one possible explanation for a name feeling dated at one time and appealing later. The SSA files do not record parents’ reasons, so the explanation should remain a hypothesis here. The curves show use changing over time, rather than a survey of what each generation thought.
Use the history as context
A revived name can offer both a long history and a place in the current cohort. If that appeals to you, inspect its recent years, related spellings and local use. You do not need to prove that it is “due” for a comeback to choose it.
See how to read a decade chart, and compare how quickly different names fall from their peaks. Both help distinguish a historical pattern from a prediction.
Data and method
These calculations use the SSA’s pinned 2025 national release. “Published counts” means the sum of the name counts available for that year and sex. Names with fewer than five occurrences are withheld, so this denominator is not a complete count of all births. Historical records before 1937 are also incomplete. Each spelling is measured for the sex named in its panel. The chart divides its annual count by the published total for that sex and multiplies by 1,000. The six examples are deliberately selected and are not a random sample.
Download the chart data (CSV). The SSA download page provides the original files, and its background notes describe coverage and spelling conventions.