
How Long Does a Baby Name Take to Fall Below Half Its Peak?
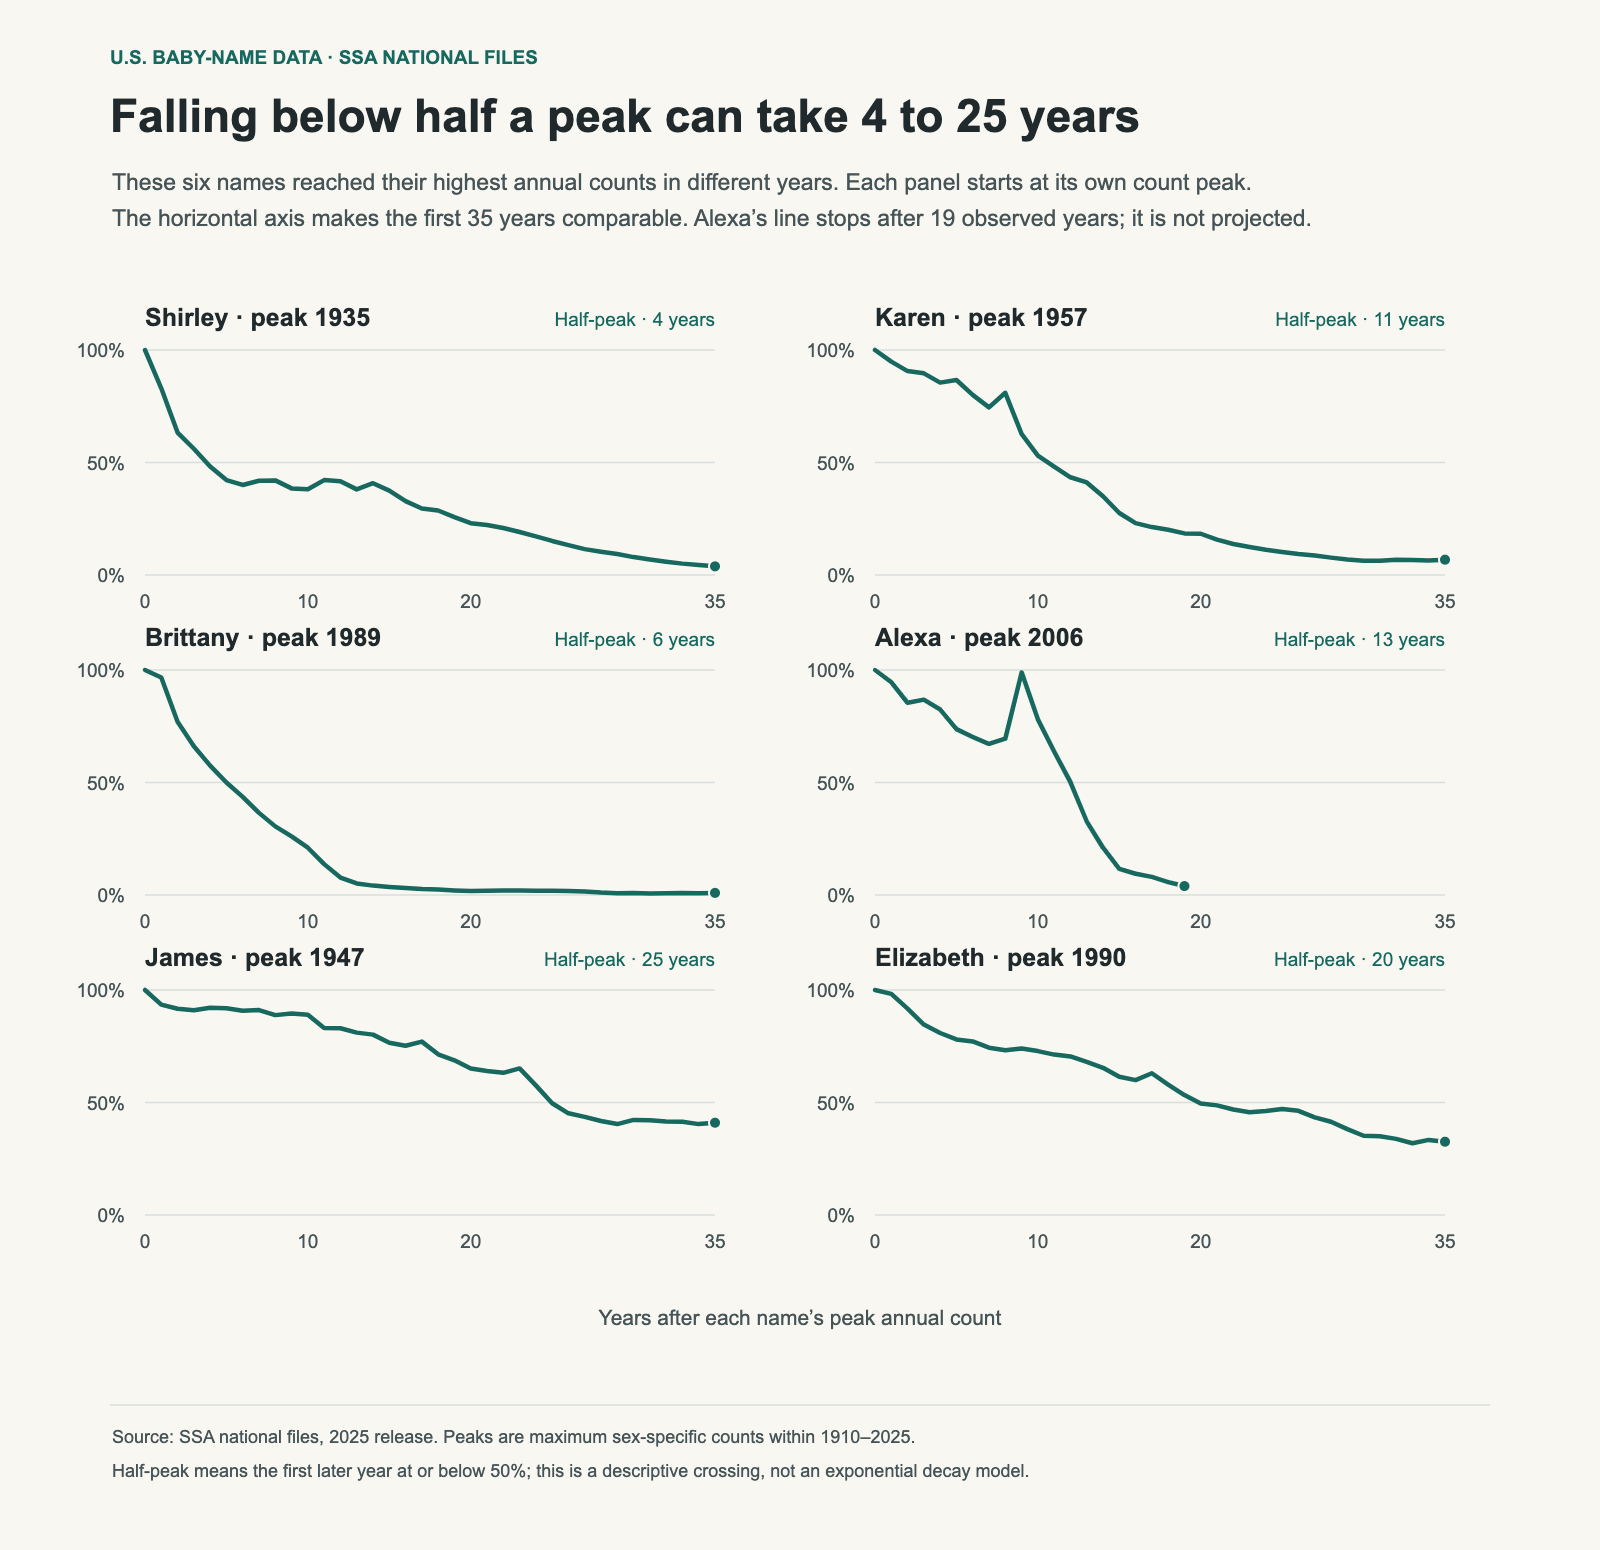
Shirley fell below half its highest annual count four years after its 1935 peak. James took 25 years after its 1947 peak. Brittany took six years, Karen eleven, Alexa thirteen and Elizabeth twenty.
These histories offer a way to compare persistence without calling every rising name a fad or every familiar name immune to decline. A name can lose a large share of its peak count and still remain near the top of the rankings.
What “half-peak” means here
For each name and sex, I found the largest annual count from 1910 through 2025. I then found the first later year with a count at or below half that maximum. It is a descriptive crossing, rather than a fitted scientific half-life. Names can rise again after crossing the line.
This distinction matters because the paths are uneven. They can have smaller recoveries, second peaks and periods of relative stability. A single number is useful for comparison, but it cannot replace the full curve.
| Name | Peak year · count | Years to half | 2025 count | 2025 rank |
|---|---|---|---|---|
| Shirley | 1935 · 42,366 | 4 | 133 | #1581 |
| Karen | 1957 · 40,591 | 11 | 175 | #1279 |
| Brittany | 1989 · 37,792 | 6 | 281 | #928 |
| Alexa | 2006 · 6,117 | 13 | 243 | #1029 |
| James | 1947 · 94,767 | 25 | 11,945 | #6 |
| William | 1947 · 67,002 | 25 | 10,545 | #9 |
| Elizabeth | 1990 · 20,750 | 20 | 6,760 | #17 |
James declined and stayed prominent
James fell from 94,767 boys in 1947 to 11,945 in 2025, a reduction of about 87%. Yet it ranked sixth in 2025. William also remained in the top ten, with 10,545 boys and rank nine. Elizabeth ranked seventeenth, with 6,760 girls.
Those examples show why “still popular” and “far below its peak” are compatible. The size of the cohort and the concentration of leading names have changed. A name does not need its mid-century count to retain a high position on today’s list.
The top-ten concentration chart supplies that wider context: popular names collectively cover a smaller share now. The count-based comparison here should be read beside shares if the question is how common the name feels within its generation.
Different peaks must be treated consistently
Alexa’s largest count in this window is 6,117 in 2006. It also had a later count of similar size, but starting the chart at a later high point would change the measured decline. The same peak rule is applied to all six panels rather than choosing a convenient starting year for one name.
The observation windows also differ. Thirty-five years after James’s peak is 1982; thirty-five years after Elizabeth’s is 2025. Alexa has not yet supplied 35 years of post-peak data. Its line stops in 2025 rather than extending an assumed decline.
The curve cannot identify a cultural cause
A famous bearer, product name or media association may influence naming choices. The annual counts do not record that influence directly. The curves cannot by themselves separate an external event from an existing decline or a broader change in taste.
It would therefore be misleading to describe all four girls’ names as a measured pop-culture category that always loses 95% of its use within fifteen years. The observed halfway crossings differ, and several declines began long before later cultural associations.
Compare persistence without treating it as a verdict
If you like a name, look for the shape that matters to you: a recent rise, a long plateau, or a decline from a much larger cohort. None is automatically better. A historical curve can tell you what use looked like; it cannot guarantee future popularity or whether your family will enjoy the name.
Compare names that later recovered and use a shared shortlist to keep the data connected to an actual choice.
Data and method
These calculations use the SSA’s pinned 2025 national release. “Published counts” means the sum of the name counts available for that year and sex. Names with fewer than five occurrences are withheld, so this denominator is not a complete count of all births. Historical records before 1937 are also incomplete. Peak counts are calculated separately by sex. Relative counts are divided by the observed peak, and no manually selected peak overrides are used. The CSV includes all available post-peak years; the chart displays at most 35.
Download the chart data (CSV). The SSA download page provides the original files, and its background notes describe coverage and spelling conventions.