
The Top Ten Baby Names Cover Far Fewer Babies Now, 1910–2025
In 1950, about one in three boys represented in the national name files received one of the ten leading names. In 2025, the top ten accounted for about one in thirteen. James was the leading boys’ name in 1950, with 86,228 recorded occurrences. Liam led in 2025 with 20,818. Both names ranked first, but that position represented a very different share of the year’s names.
The change extends beyond the leading name. Girls’ top-ten share fell from 24.1% to 7.0% over the same years. Popular names still exist; they occupy less of the total. That helps explain why a name can be nationally prominent without appearing in every classroom.
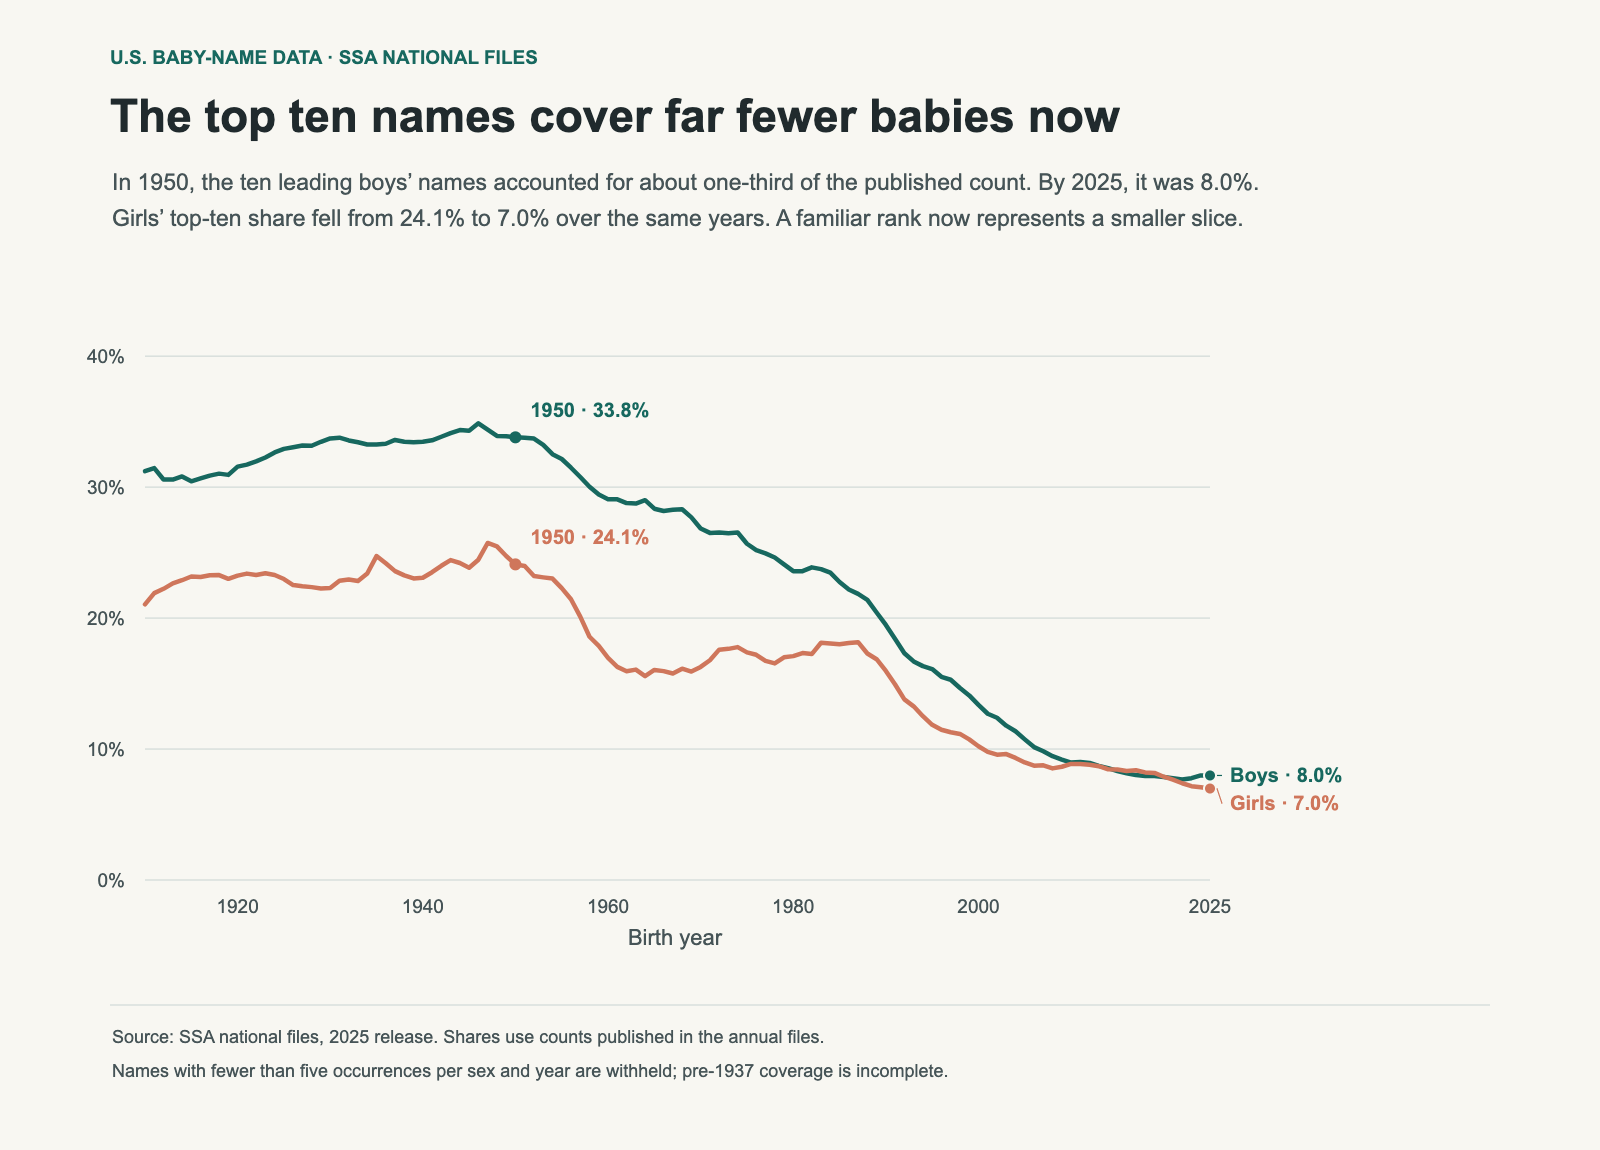
The same rank now covers a smaller slice
Rank records order. It does not preserve the distance between names, or the share represented by that position. James’s 1950 count was 4.82% of the published boys’ total. Liam’s 2025 count was 1.22%. For girls, Linda’s 1950 share was 4.70%; Olivia’s 2025 share was 0.84%.
A number-one name therefore need not be as concentrated as a number-one name remembered from an older generation. Comparing the label alone can make current popularity seem larger than it is. The count and share provide the scale that the rank leaves out.
| Year | Boys’ top 10 | Girls’ top 10 | Leading boy: share | Leading girl: share |
|---|---|---|---|---|
| 1930 | 33.7% | 22.3% | Robert · 5.66% | Mary · 5.70% |
| 1950 | 33.8% | 24.1% | James · 4.82% | Linda · 4.70% |
| 1970 | 26.8% | 16.3% | Michael · 4.59% | Jennifer · 2.64% |
| 1990 | 19.5% | 16.0% | Michael · 3.18% | Jessica · 2.45% |
| 2010 | 9.0% | 8.9% | Jacob · 1.15% | Isabella · 1.29% |
| 2025 | 8.0% | 7.0% | Liam · 1.22% | Olivia · 0.84% |
The girls’ and boys’ paths were different
In 1970, the boys’ top ten represented 26.8% of published counts, while the girls’ top ten represented 16.3%. The gap was much smaller by 2010: 9.0% for boys and 8.9% for girls. By 2025 both were below 8%, with boys still slightly higher.
Boys’ leading names were more concentrated during much of the earlier record. The counts do not tell us that every family followed the same preference, or establish why the two series changed. Explaining a role for family traditions, media or naming websites would require evidence beyond these annual counts.
What is happening outside the top ten?
When the top-ten share falls, the remaining names collectively gain share. That does not mean every less-common name rises, or that the number of possible names grows at the same rate. Some names outside the top ten can decline while others gain. This chart measures concentration at one cutoff; it does not describe the full distribution.
Spelling also matters. The SSA lists different spellings separately. A sound shared by several spellings may be more common than any single spelling’s rank suggests. The top ten here consists of ten exact name entries, rather than ten combined name families.
What this means for a shortlist
Use the national share to understand scale, then check the state and years that matter to your family. A low national share cannot guarantee that a name will be rare in a particular school or neighbourhood. Local concentration, cohort size and related spellings all change that experience.
Popularity also is not a reason to reject a name you like. This comparison gives you a more precise question: how much of today’s cohort does it represent? For a close contest between two names, see what the Olivia–Charlotte gap reveals. For the shape of a name’s history, read how to compare decades.
Data and method
These calculations use the SSA’s pinned 2025 national release. “Published counts” means the sum of the name counts available for that year and sex. Names with fewer than five occurrences are withheld, so this denominator is not a complete count of all births. Historical records before 1937 are also incomplete. The ten largest counts are selected separately for each sex and year and divided by that year’s published total. A count tie is ordered alphabetically, with exactly ten entries selected.
Download the chart data (CSV). The SSA download page provides the original files, and its background notes describe coverage and spelling conventions.