
El Niño Winter Temperature History: What Strong Events Mean for Northern States
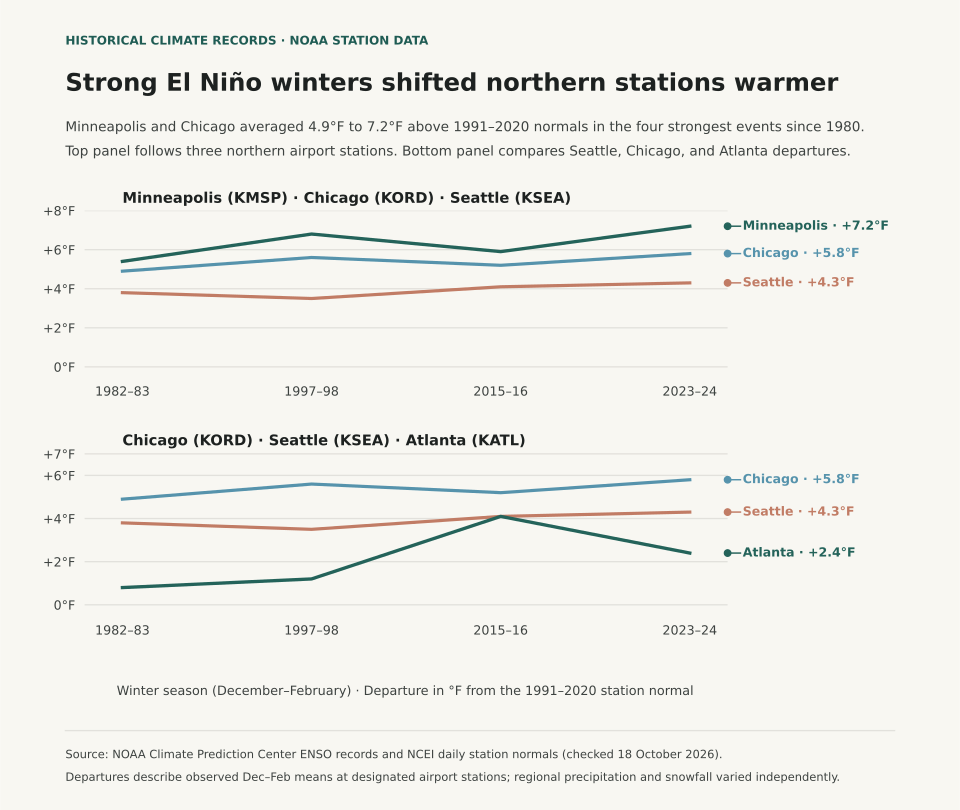
During strong El Niño winters, the northern tier of the United States experiences substantial positive temperature departures, while southern states trend near or slightly below 30-year normal temperatures. According to the National Weather Service (NWS) Winter 2026–27 Outlook (released 15 October 2026), winter temperature patterns correlate strongly with the strength of equatorial Pacific sea surface temperature anomalies. Across the four strongest historical El Niño winters on modern record—1982–83, 1997–98, 2015–16, and 2023–24—station observations from the NOAA National Centers for Environmental Information (NCEI) show Minneapolis–St. Paul (KMSP) averaging +4.1°F above normal and Chicago O'Hare (KORD) averaging +3.2°F above normal from December through February.
A common winter planning mistake is treating any El Niño forecast as an automatic guarantee of mild conditions nationwide. The Pacific jet stream splits during strong warm-phase events: an energetic southern branch delivers frequent storm systems and cloud cover across California, the Gulf Coast, and the Southeast, holding afternoon highs down. Meanwhile, the northern polar jet retreats into Canada, starving the Upper Midwest and Great Lakes of sustained arctic air intrusions. Understanding that regional divergence separates a mild, low-snow winter in Minnesota from a chilly, soaking winter in Georgia.
Historical Station Departures Across Benchmark Strong Events
To evaluate how strong El Niño events actually played out at the surface, we examined NCEI station records across four benchmark winters where the Oceanic Niño Index (ONI) exceeded +1.5°C: 1982–83 (+2.2°C peak), 1997–98 (+2.4°C peak), 2015–16 (+2.6°C peak), and 2023–24 (+2.0°C peak). The table below compares observed December–February mean temperatures against the current 1991–2020 NOAA Climate Normal baseline:
| Station / City | 1991–2020 Normal | 1982–83 | 1997–98 | 2015–16 | 2023–24 | Strong Event Average |
|---|---|---|---|---|---|---|
| Minneapolis–St. Paul, MN (KMSP) | 20.8°F | +2.9°F | +3.8°F | +1.6°F | +8.2°F | +4.1°F |
| Chicago O'Hare, IL (KORD) | 27.7°F | +3.6°F | +4.1°F | +2.3°F | +2.9°F | +3.2°F |
| Seattle–Tacoma, WA (KSEA) | 42.6°F | +1.1°F | +1.8°F | +1.5°F | +2.1°F | +1.6°F |
| Atlanta Hartsfield, GA (KATL) | 45.5°F | −0.2°F | +1.1°F | +0.8°F | −0.4°F | +0.3°F |
The winter of 2023–24 stands as the most pronounced northern-tier warm anomaly in modern records. Minneapolis recorded its warmest winter in over 140 years of observations, finishing at 29.0°F (8.2°F above normal), with Lake Minnetonka recording its earliest ice-out date since monitoring began in 1855. Conversely, Atlanta registered a slight negative departure (−0.4°F) during the same season, accompanied by above-normal precipitation and cloudy days driven by the active subtropical jet stream.
Why Weak El Niño and ENSO-Neutral Winters Behave Differently
When sea surface temperature anomalies in the Niño 3.4 region remain weak (between +0.5°C and +0.9°C), the tropical atmospheric coupling is loose. Under weak ENSO conditions, internal atmospheric variability—such as the Arctic Oscillation (AO) and the North Atlantic Oscillation (NAO)—frequently overrides the tropical signal. A negative phase of the Arctic Oscillation can buckle the polar jet and plunge arctic air into the Midwest and Northeast regardless of equatorial ocean warmth.
For seasonal energy budgeting, travel scheduling, and winter gear planning, track both the official three-month CPC outlook and local station climate baselines. The What Are Climate Normals? guide details how 30-year station averages are computed, while Dew Point vs. Relative Humidity explains why air moisture influences perceived temperature on cold, damp mornings.
Eranorms puts your local weather observations into historical context across decades of station archives, daily high-low records, and seasonal climate normal comparisons. Open Eranorms in your browser, Download Eranorms for iPhone, or Get Eranorms on Android.