
How the Long-Name Gap Between Girls and Boys Narrowed, 1880–2025
In the 1990s, half the names on girls’ yearly top-100 lists had seven or more letters. On boys’ lists, fewer than three in ten did. Jessica, Jennifer, Samantha and Stephanie all appeared in the girls’ top 100 throughout that decade. Long names occupied so much of the list that four-letter names such as Anna and Mary belonged to a small minority.
Across 2020–25, long names account for 30.4% of girls’ list entries and 25.8% of boys’ entries. The gap has narrowed from 21.2 percentage points to 4.6. Much of that change comes from the return of short girls’ names. But the lists have not become identical: girls’ names now occupy both the short and long ends more often, while boys’ names are more concentrated in the middle.
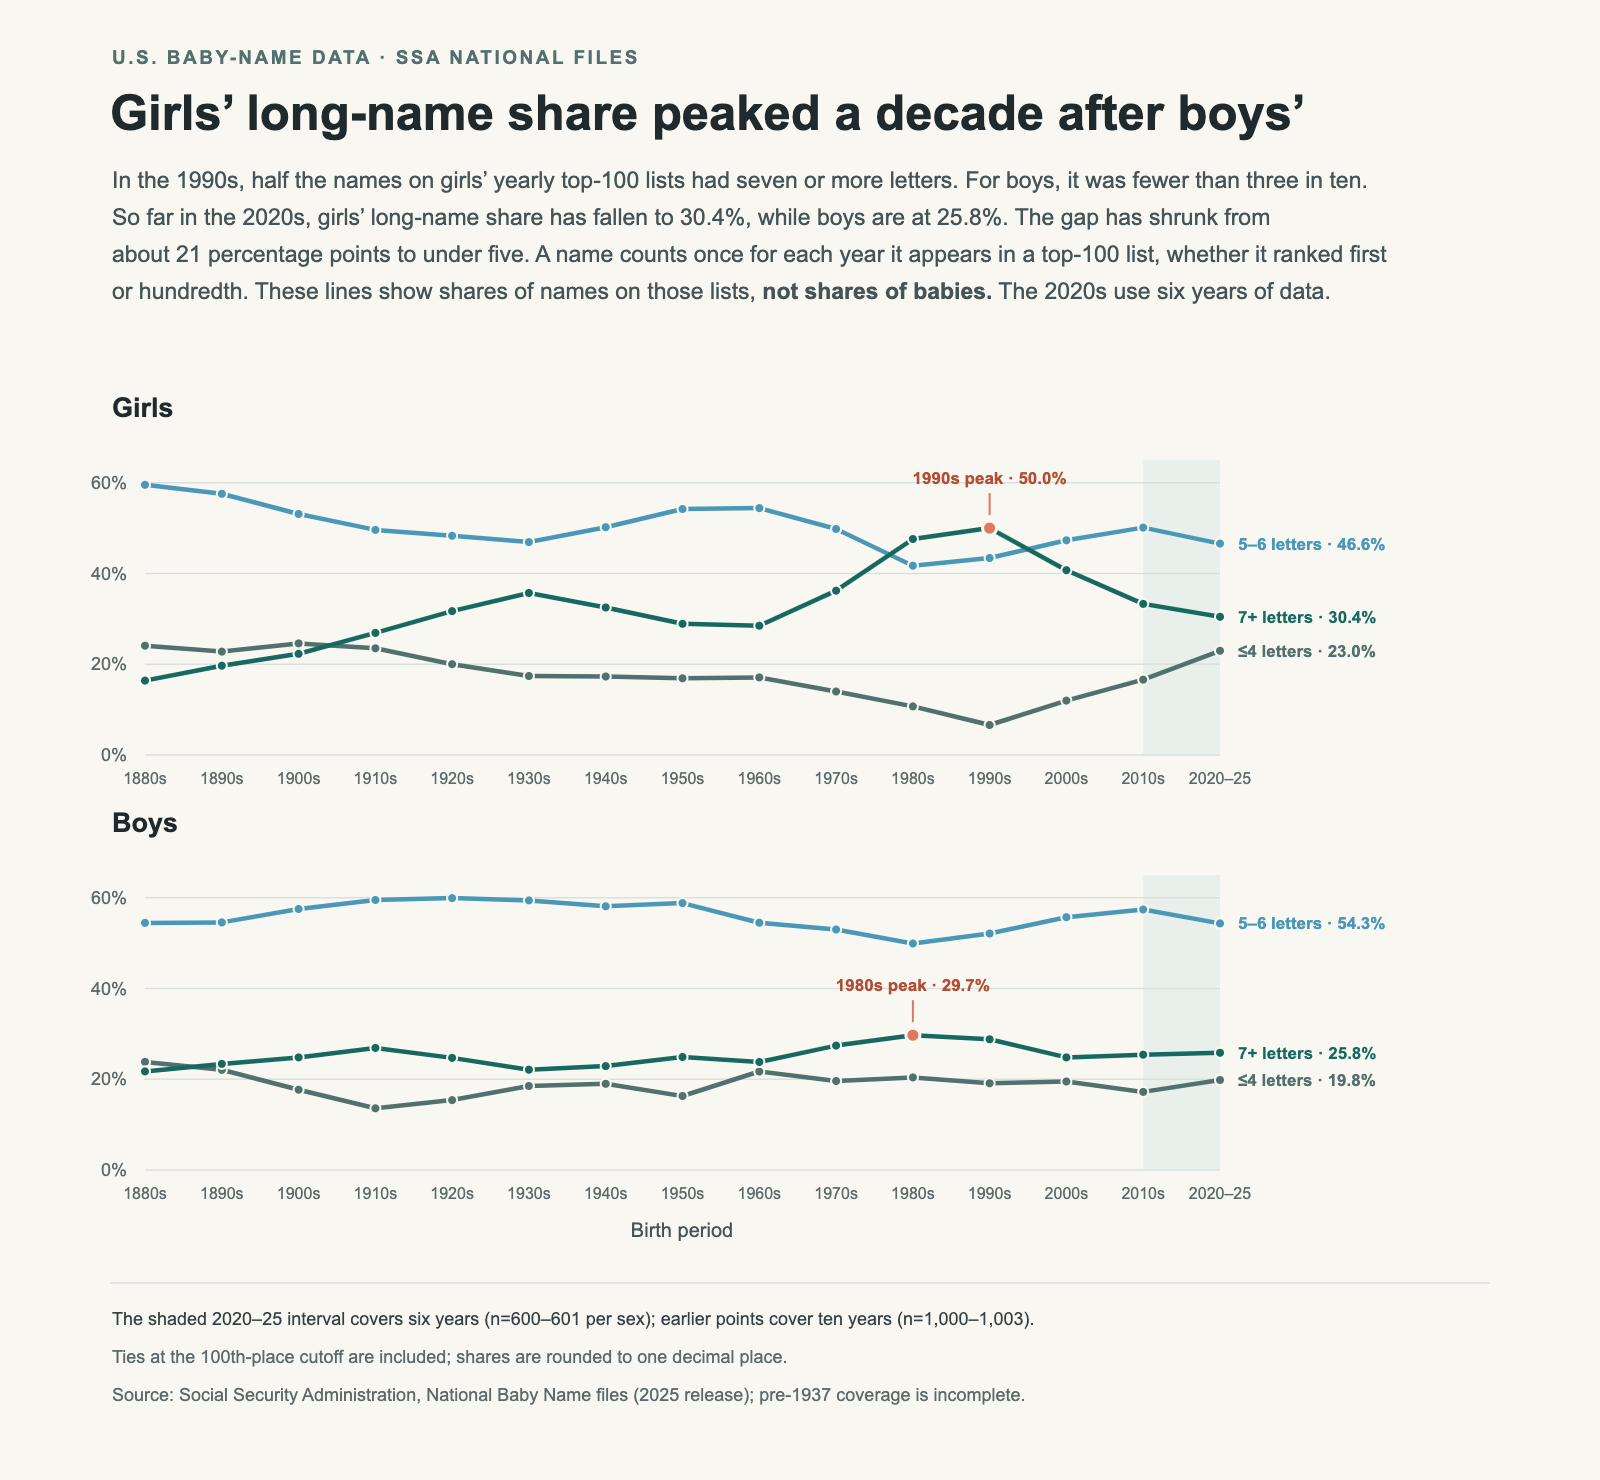
Picture a top-100 list with every name printed on a card. In the 1990s, about 50 of the girls’ cards would have names at least seven letters long. In 2020–25, it would be about 30. Each card counts equally, whether its name ranked first or 100th. These percentages describe the names on the lists, not how many babies received them.
A few examples of each length, drawn from the historical lists:
- 4 letters: girls Anna, Mary; boys John, Paul
- 5 letters: girls Sarah, Alice; boys James, David
- 6 letters: girls Martha, Evelyn; boys Thomas, Joseph
- 7 letters: girls Kathryn, Lillian; boys William, Michael
The three lines group names into four or fewer letters, five to six, and seven or more. Each point pools the yearly lists within that period, so a name appearing in all ten years counts ten times. The shaded 2020–25 point uses the six years available so far.
Girls’ names did not always lean toward the long end
In the 1880s, nearly six in ten entries on girls’ lists had five or six letters. Only 16.4% had seven or more, compared with 21.7% on boys’ lists. Long names were a smaller part of the girls’ list at the beginning of this series.
That balance changed over several generations. Girls’ long-name share reached 26.9% in the 1910s and 35.7% in the 1930s. The rise then reversed for a while: the share slipped to 28.5% in the 1960s before climbing again. By the 1980s it was 47.6%, and in the 1990s it reached 50.0%, its highest point in the series.
The short end moved in the opposite direction over that longer stretch. Names of four or fewer letters accounted for 24.1% of girls’ entries in the 1880s, but just 6.6% in the 1990s. Anna and Mary still appeared in every annual top 100 in the 1990s; short names had become a much smaller group around them. Five- and six-letter names also remained common, at 43.4%.
Different names entered, stayed in, and left the top 100 over time.
Boys’ lists stayed closer to the middle
Five- and six-letter names form the largest group on boys’ lists in every period shown. Their share ranges from 49.9% in the 1980s to 59.9% in the 1920s. Names such as James, David, Thomas and Joseph illustrate that middle range; all four appeared in every annual boys’ top 100 in the 1880s, the 1990s and 2020–25.
Boys’ long-name share does change, but within a smaller range: from 21.7% in the 1880s to a peak of 29.7% in the 1980s. Girls reached their peak a decade later, and at a much higher level. In the 1990s, the girls’ list contained roughly 21 more long names per 100 entries than the boys’ list.
The recent convergence comes mainly from girls’ lists moving away from that peak. Since the 1990s, girls’ long-name share has fallen by 19.6 percentage points, while boys’ has fallen by 3.0.
Where did the girls’ long-name share go?
Most of the difference appears at the short end. The share of girls’ names with four or fewer letters rose from 6.6% in the 1990s to 23.0% in 2020–25, an increase of 16.4 percentage points. The middle group rose by a smaller 3.2 points, from 43.4% to 46.6%.
Emma, Ava, Mia and Luna each appear in all six girls’ top-100 lists from 2020 through 2025. Long names remain visible too: Charlotte, Elizabeth and Isabella also appear in every one of those six lists. A shrinking long-name share can coexist with individual long names remaining popular.
| Period | List | ≤4 letters | 5–6 letters | 7+ letters |
|---|---|---|---|---|
| 1880s | Girls | 24.1% | 59.5% | 16.4% |
| 1880s | Boys | 23.8% | 54.4% | 21.7% |
| 1990s | Girls | 6.6% | 43.4% | 50.0% |
| 1990s | Boys | 19.1% | 52.1% | 28.8% |
| 2020–25* | Girls | 23.0% | 46.6% | 30.4% |
| 2020–25* | Boys | 19.8% | 54.3% | 25.8% |
*Six years of an unfinished decade. Percentages are rounded independently and may not sum to exactly 100%.
Girls’ lists contain a larger share of both short names and long names than boys’ lists. Boys’ lists have more five- and six-letter names: 54.3%, compared with 46.6% for girls. Describing girls’ names simply as “longer” misses the growing short group.
Nearly the same average, with a different mix
The average letter count provides another way to check the pattern. For girls’ yearly top-100 lists, the average rose from 5.44 letters in the 1880s to 6.53 in the 1990s, the highest completed-decade mean. It then fell to 5.78 across 2020–25.
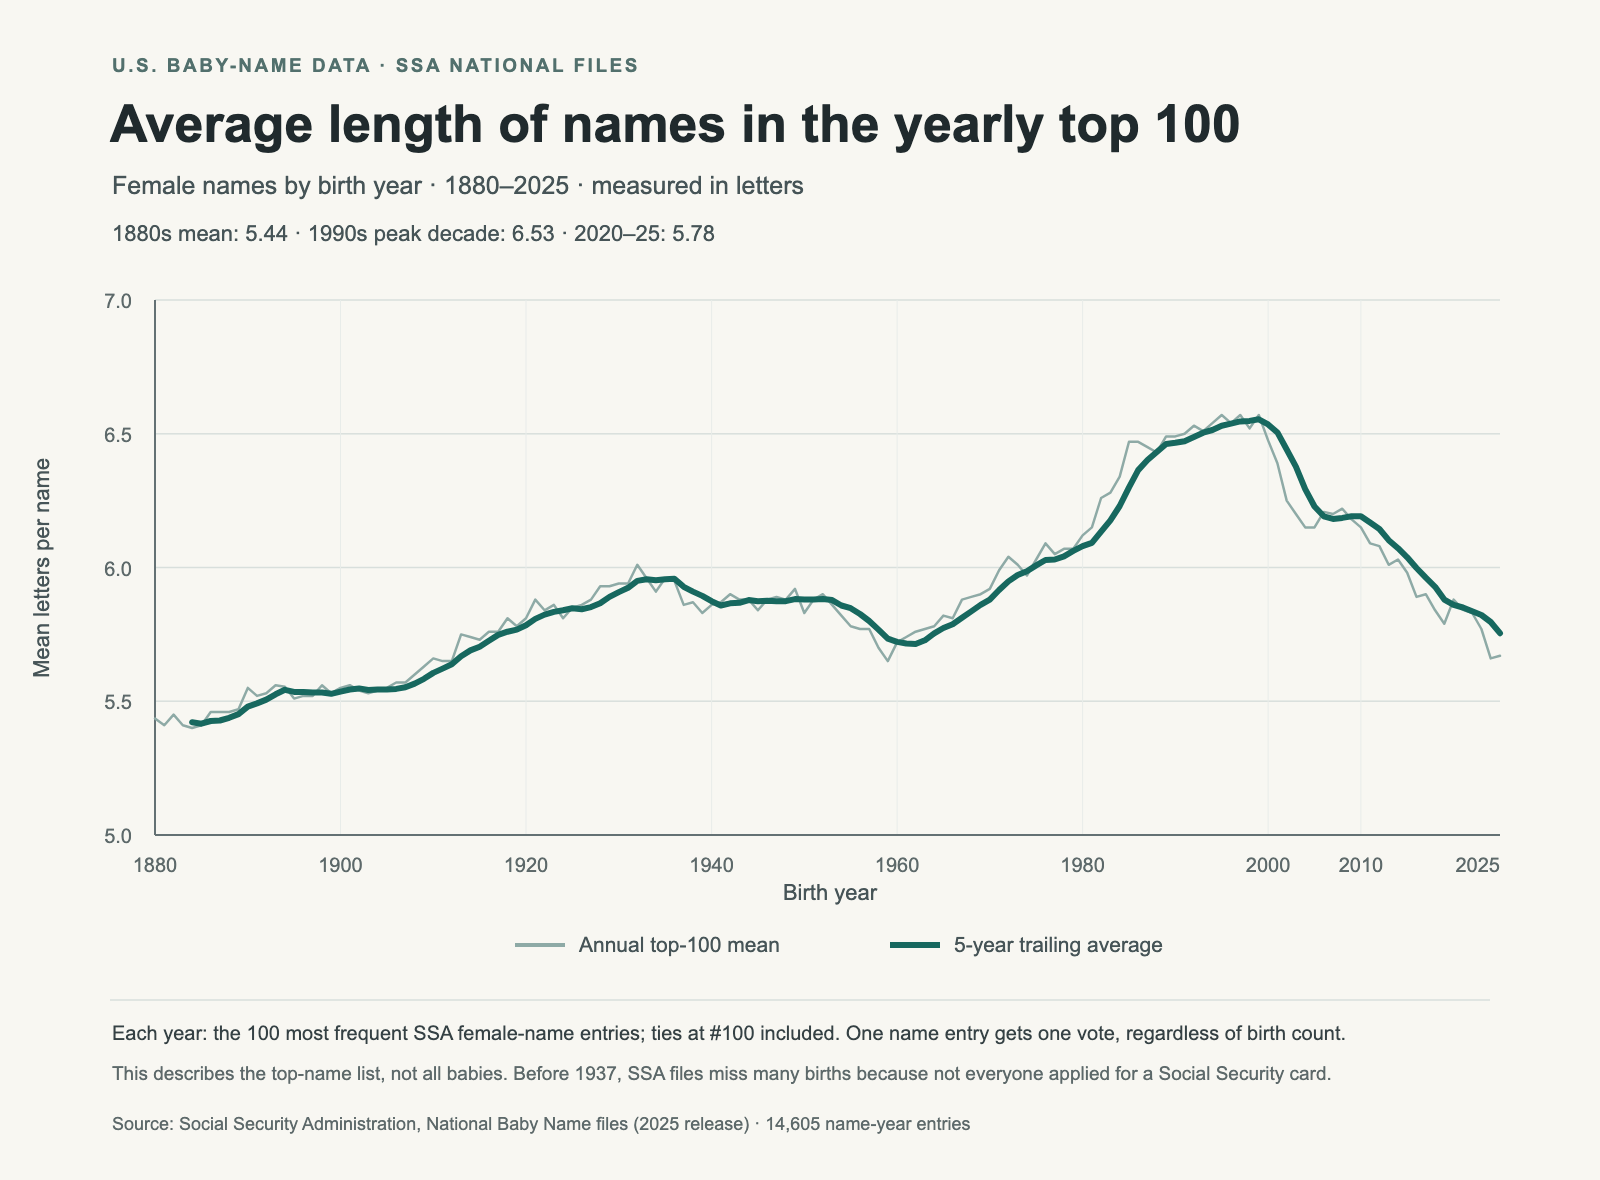
Boys’ average was 5.79 letters in the 1990s and is 5.75 across 2020–25. The difference between girls’ and boys’ averages has therefore narrowed from about three-quarters of a letter to just 0.02 letters. Those nearly equal averages conceal the different distributions in the three-line chart: girls have more names at both ends, and boys have more in the middle.
The mean also helps show that the girls’ shift is broader than a change around the seven-letter cutoff. Both the share of long names and the average length have fallen since the 1990s. The bands tell us where the mix changed; the average summarizes its overall length.
Why keep the unfinished 2020s?
Stopping at the 2010s would leave out the latest part of the story. Girls’ short-name share has risen from 16.6% in that decade to 23.0% across 2020–25, while their long-name share has fallen from 33.3% to 30.4%. The recent years continue the movement away from the 1990s peak.
The chart labels that point as 2020–25 and shades the final interval because six years do not represent a completed decade. Every earlier point pools ten annual lists. The 2020s point will change when later years are added; it describes the years observed, rather than predicting the decade’s final result.
How the lists were measured
I used one pinned release of the Social Security Administration’s national name files, covering birth years 1880 through 2025. For each year, female-name and male-name records were ranked separately by birth count. I selected the top 100 entries and included every name tied at the 100th entry’s count. Complete decades contain 1,000–1,003 name entries across their ten lists; 2020–25 contains 601 for girls and 600 for boys.
Each name counts once for each year it appears. A name that stays in the top 100 for a whole decade contributes ten entries; a name present for one year contributes one. The three bands cover every selected entry. Period shares divide the count in each band by the total number of entries in that period. The annual-average chart first averages the letter counts within each year; the period averages quoted above average those yearly means.
This weighting answers a specific question: what lengths were represented on the popular-name lists? It gives the first- and 100th-ranked names equal weight. Measuring the lengths of names actually received by babies would require weighting each name by its birth count. Names outside the top 100 would also need to be included for a population-wide answer.
What these charts cannot explain
Letter count is a spelling measure. It does not measure syllables, how long a name takes to say, or the nickname someone uses. Different spellings remain separate entries. The SSA also removes spaces and hyphens before tabulating names, so the length measured here is the length stored in its files. These conventions are described in the SSA’s data qualifications.
The early years need extra care. The SSA says many people born before 1937 never applied for a Social Security card, leaving their names out of the records. The 1880s figures describe the available historical records and should not be read as a complete census of births. See the SSA’s source and coverage notes.
The series shows when the mix changed, but cannot establish why parents chose those names. Explanations involving family traditions, celebrities or changing tastes would need evidence beyond these lists, such as surveys of parents or research connecting particular names to those influences.
Data and further reading
Download the counts and shares behind the three-line chart (CSV). The file includes each period’s start and end year, number of years included, and denominator, so the partial 2020s can be identified directly.
For another view of the annual rankings, read how the most popular names shift by decade or see how close rankings can hide a near tie. You can explore individual name histories in Name Scout.