
Lake-Effect Snow Instability: Why Convection Requires a 13°C Water-to-Air Gap
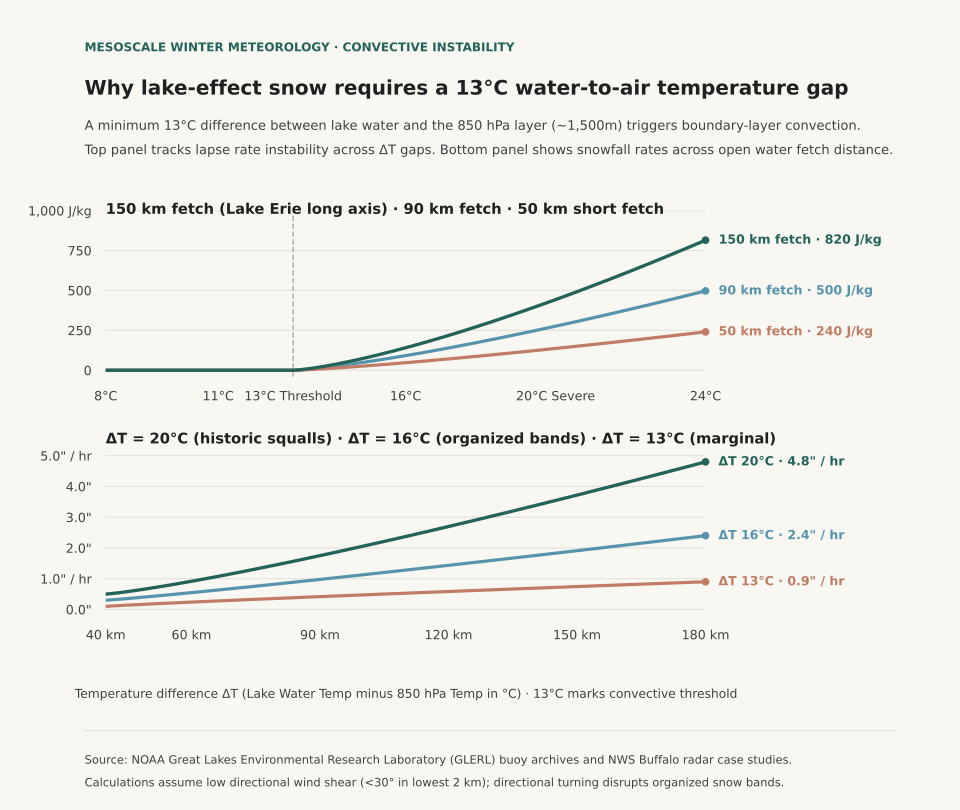
Lake-effect snow squalls form only when the temperature difference between the relatively warm lake surface water and the upper-air atmospheric layer at 850 hectopascals (hPa, approximately 1,500 meters or 5,000 feet aloft) reaches or exceeds an absolute minimum threshold of 13°C (23.4°F). According to forecasting criteria cataloged by the National Weather Service (NWS) JetStream School and mesoscale sounding analyses from NWS Weather Forecast Office Buffalo, a 13°C temperature differential across that 1.5-kilometer vertical layer establishes a dry adiabatic lapse rate within the marine boundary layer. That thermal instability allows heat and water vapor escaping the lake to trigger vigorous convective updrafts, transforming cold arctic air masses into intense, localized snow bands producing snowfall rates between two and five inches per hour.
Winter travelers watching weather forecasts across the Great Lakes often look at surface thermometer temperatures in coastal cities like Buffalo, Cleveland, or Muskegon. Surface air temperature alone cannot predict whether lake-effect snow will materialize. If Lake Erie surface water sits at 4°C (39°F) in early December while 850 hPa temperatures hover at −5°C, the temperature gap is only 9°C; in that scenario, the atmosphere remains convectively stable, producing low stratocumulus clouds and flurries. When an arctic front drives 850 hPa temperatures down to −16°C, the temperature difference expands to 20°C, triggering extreme boundary layer convective available potential energy (CAPE) and historic thundersnow squalls.
The Physics of Fetch: Why Trajectory Dictates Squall Intensity
In addition to the 13°C vertical temperature difference, lake-effect snow band formation requires sufficient horizontal residence time over open water, termed fetch distance. Meteorological studies show that cold air must travel over open water for at least 80 to 100 kilometers (50 to 60 miles) to absorb enough moisture and latent heat to develop organized, multi-cellular precipitation bands. When wind aligns with the long axis of Lake Erie (a southwest-to-northeast fetch of approximately 200 kilometers) or Lake Ontario (westerly flow into Watertown and the Tug Hill Plateau), convective plumes merge into a single stationary band that dumps feet of snow on a single highway corridor while airports ten miles north remain completely dry.
Wind shear within the lowest two kilometers also governs band organization: directional wind shear exceeding 30 degrees between the lake surface and the top of the convective boundary layer shreds updrafts, scattering precipitation into unorganized cellular squalls. The table below traces NWS convective instability categories across temperature gaps and corresponding snowfall rates:
| Lake Water Temp (°C) | 850 hPa Temp (°C) | Vertical Gap (ΔT) | Atmospheric Stability Category | Typical Snowfall Intensity | Weather Radar Appearance |
|---|---|---|---|---|---|
| +10°C (50°F) | 0°C (32°F) | 10°C | Stable; inversion caps boundary layer | 0.0 in/hr (Trace flurries) | Widespread shallow stratocumulus |
| +10°C (50°F) | −3°C (26.6°F) | 13°C | Conditional instability; threshold reached | 0.5 to 1.0 in/hr | Scattered light convective showers |
| +8°C (46.4°F) | −8°C (17.6°F) | 16°C | Moderate instability; dry adiabatic layer | 1.5 to 2.5 in/hr | Organized multiple parallel bands |
| +6°C (42.8°F) | −14°C (6.8°F) | 20°C | Extreme instability; high CAPE layer | 3.0 to 5.0 in/hr | Single intense band; lightning & thundersnow |
| +4°C (39.2°F) | −18°C (−0.4°F) | 22°C | Severe convective instability | 4.0 to 6.0 in/hr | Historic blizzard squalls; zero visibility |
Why Midwinter Ice Cover Shuts Down the Lake-Effect Engine
The annual peak of lake-effect snow occurs from mid-November through early January when Great Lakes surface water retains warmth absorbed during summer while arctic air masses begin surging southward. By late January and February, water temperatures drop toward 0°C to 2°C (32°F to 35°F) and ice cover expands across shallow basins like Lake Erie, which averages only 62 feet in depth. Once ice covers more than 70% to 80% of a lake basin, the physical interface between air and water is sealed, cutting off evaporation and shutting down lake-effect snow regardless of upper-air cold.
When tracking regional winter weather across the Midwest and Northeast, evaluate surface lake observations alongside upper-air sounding reports. For analysis of vertical temperature inversions in freezing precipitation, read Freezing Rain vs. Sleet: How Warm Layers Aloft Dictate Surface Icing, and see Wind Chill vs. Actual Temperature to understand boundary-layer convective cooling on exposed skin.
Eranorms displays historical weather observations, upper-air sounding timelines, and 30-year seasonal climate normal comparisons across first-order weather stations nationwide. Open Eranorms in your browser, Download Eranorms for iPhone, or Get Eranorms on Android.