YellowSquared  /  Field notes

Notes from the workshop

53 posts, newest first. Choose an app to narrow the feed.

049 / 53

Winter Lows at Six U.S. Airports: 66 Winters in Context

The later 30-year winter average is higher at each of these six U.S. airport stations. In NOAA’s daily records, the mean winter low rises by about 0.7°F to 4.1°F when we compare winters ending in 1961–1990 with winters ending in 1991–2020. The size of the difference varies by airport, and a recent cold winter can still sit below the later reference.

That answers a specific question about the records at Seattle–Tacoma, Boston Logan, Chicago O’Hare, New York JFK, Phoenix Sky Harbor and San Francisco International. It does not measure the change in every neighbourhood, establish a national warming rate or isolate the cause of a station’s change. Several observing sites moved, and their instruments and reporting practices changed too. Those details belong beside the temperature history.

Compare the same winter measure

Here, “winter low” means the average of the daily minimum air temperatures during December, January and February. It is not the winter’s single coldest reading, an average of every nighttime hour or a prediction of frost in a garden.

Each winter is labelled by the year in which it ends. Winter 2026 covers December 2025 through February 2026. The first comparison period contains 30 winters ending in 1961–1990; the second contains 30 ending in 1991–2020. We give each winter equal weight within its period.

Mean winter daily low in two 30-winter periods. NOAA GHCN-Daily station records; calculated averages in °F.
Airport station1961–19901991–2020Later minus earlier
Seattle–Tacoma36.1°F36.9°F+0.7°F
Boston Logan23.7°F25.9°F+2.2°F
Chicago O’Hare16.5°F20.1°F+3.6°F
New York JFK27.2°F29.1°F+1.9°F
Phoenix Sky Harbor42.4°F46.5°F+4.1°F
San Francisco International42.8°F45.5°F+2.7°F

Differences are calculated before rounding, so subtracting the displayed one-decimal averages can give a slightly different result. For a temperature difference, 1°F is about 0.56°C: the changes here range from roughly 0.4°C to 2.3°C. These are descriptions of the selected station records, with no adjustment applied here for changes in site, equipment or surrounding development.

One winter can run against the longer comparison

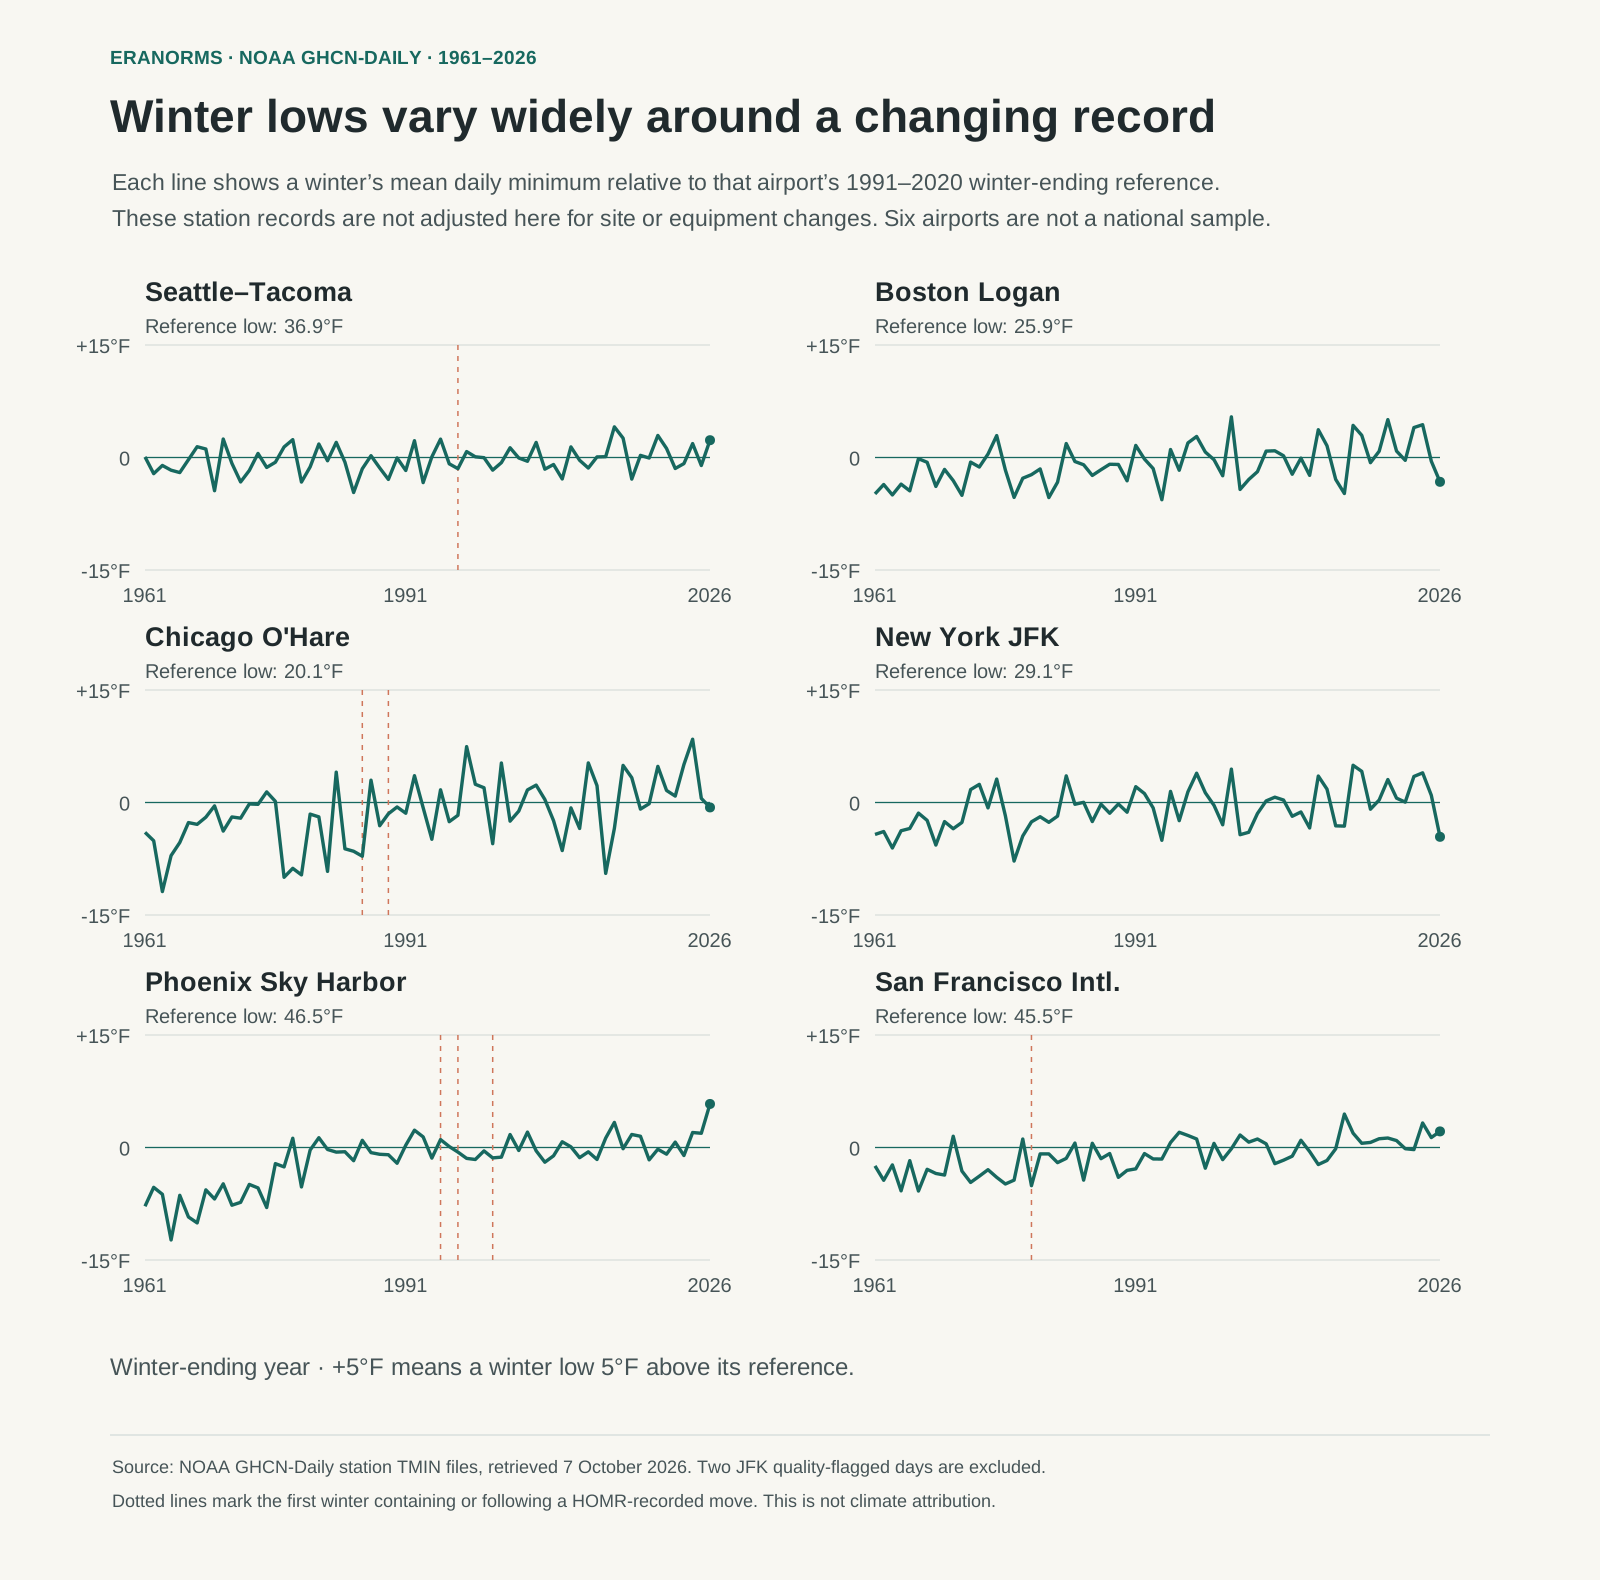
The chart shows all 66 winters ending in 1961–2026. Each airport has its own zero line: its calculated 1991–2020 winter reference. A point at +5°F means that winter’s average daily low was 5°F above that airport’s reference. The panels share the same vertical scale, so a larger departure remains larger across airports.

Six airport winter histories from 1961 through 2026, showing large year-to-year variations around each station’s calculated 1991–2020 winter reference. Dotted lines mark documented site moves.
NOAA GHCN-Daily minimum-temperature records, retrieved 7 October 2026. The zero line is a calculated winter-ending reference, not the official NOAA Climate Normal. Dotted lines mark the first winter containing or following a move recorded in NOAA’s station history. Quality-flagged readings are excluded; these records have not been adjusted here for site or equipment changes. Download the winter series or open the full chart.

Winter 2026 provides a useful counterexample to a simple “every winter gets warmer” interpretation. Boston’s mean daily low was 22.7°F, about 3.2°F below its reference. JFK was 24.6°F, about 4.6°F below its reference, and O’Hare was 19.4°F, about 0.7°F below. Their later 30-year averages can be higher while an individual winter is colder than that average.

The western examples went the other way that winter: Phoenix averaged 52.3°F, San Francisco 47.6°F and Seattle–Tacoma 39.2°F, all above their respective references. A national headline can hide those different local experiences. Even an airport-specific winter average smooths out the cold spells within its three months.

The airport name is not a guarantee of an unchanged site

NOAA’s Historical Observing Metadata Repository, or HOMR, records physical relocations for five of the six shortlisted airports. Examples include Seattle–Tacoma’s October 1996 move, O’Hare moves in March 1985 and January 1989, and Phoenix moves in 1994, 1997 and 2000. San Francisco’s record includes a January 1979 move; JFK’s includes a December 1957 move, before the chart’s period.

A move marker is a reason to inspect the history. It does not prove a temperature change was caused by the move, and it does not tell us the size of any effect. Equipment and observing practices can change without a physical relocation. Boston’s empty relocation field also does not establish that every part of its record is unchanged. Download the recorded moves and their source links.

This is why we describe airport station records rather than a single fixed measurement outside every home in a metro area. The six airports were selected as contrasting examples from our city-comparison coverage, before inspecting the temperature differences. They are not a geographically weighted national sample. Estimating a regional or national climate trend requires an appropriate dataset and treatment of non-climatic changes.

Use the history for a practical decision

For a winter trip or a move, start with the absolute temperatures in the table. O’Hare’s later reference is about 20°F, while Phoenix’s is about 47°F. A chart of departures alone would hide that large difference in the underlying climates. Then look at the variation between winters and the month that matters to your plans.

If your concern is how often temperatures fall below freezing, use a separate count of days with a daily minimum below 32°F. A mean of 35°F does not mean every day stays above freezing. We retain those counts only for winters with every accepted daily low; the two winters affected by excluded JFK readings have no complete count. A station’s air-temperature threshold still does not predict frost at a particular garden or road surface.

Eranorms helps put a selected station’s weather into historical context. Its useful role here is to make the location and period explicit when exploring a warm day, cold spell or unusual month. Use the history to understand the range of past conditions, then check a current forecast for the actual travel dates. The city weather comparison guide helps with broader seasonal planning.

Sources, calculation and limits

The published calculation uses NOAA GHCN-Daily TMIN values from six named station files: USW00024233, USW00014739, USW00094846, USW00094789, USW00023183 and USW00023234. We checked station identities against the local app metadata and retained the NOAA histories. The figures use NOAA’s daily files rather than combining values from different daily-summary sources.

NOAA stores these temperatures in tenths of a degree Celsius. We convert them to Fahrenheit for display, omit missing values and exclude every nonblank quality flag. Two JFK readings, 22 December 1962 and 3 December 1964, carry an internal-consistency flag and are excluded. A blank flag means the value did not fail the documented checks; it does not establish that every possible error has been removed.

A monthly mean uses the accepted daily lows. We weight the three monthly means by their calendar lengths, including leap days. A winter is eligible with no more than two missing or excluded days in any month and four in the entire winter. All 66 winters pass this temperature-coverage gate at every station, including all 30 reference winters. The two affected JFK winters use the remaining accepted days; we do not insert replacement observations.

The reference spans winters ending in 1991–2020: December 1990 through February 2020. It is our calculated mean of those 30 winter means. It is not NOAA’s official 1991–2020 Climate Normal, whose production includes additional methods for station changes and missing observations. Our figures apply no station-move, equipment, urbanization or attribution adjustment. The observations support the period comparisons shown here; they do not isolate a cause or establish a nationwide rate.

For the next step, read what climate normals mean and how to read a climate stripe chart. Both explain why a baseline, a location and a stated measurement belong with every weather comparison.
050 / 53

What Are Climate Normals? A Simple Guide to 30-Year Weather Averages

A climate normal is a 30-year average used to describe what weather is typical for a place and time of year. It is not a forecast, and it does not tell you what will happen next Tuesday. It gives Tuesday a useful reference point.

QuestionA climate normal can helpA climate normal cannot answer
Is July usually hot here?Yes. Average highs and lows describe a July benchmark.Whether this July 14 will be hot.
Is this rainfall unusual?Yes. Compare it with the normal for the month.Whether the next storm will arrive on time.
Which city has drier winters?Yes. Compare the same 30-year period.Which city you will personally prefer.

Why thirty years?

One wet year or one heatwave can distort a short average. Thirty years is long enough to smooth much of that weather noise while staying recent enough to describe a modern climate. Meteorological agencies periodically update these reference periods, which is why a city’s “normal” can change even when nobody moved the weather station.

What can be a climate normal?

Temperature is the familiar example, but normals can cover much more. A weather service may publish average high and low temperatures, total precipitation, snowfall, humidity, heating and cooling degree days, or the usual date of the last spring frost. The useful unit depends on the decision. Someone packing for a trip may care about the average high and the chance of a wet month; a gardener may care more about frost timing and monthly rainfall.

If you are deciding…Start with…Then check…
When to visitMonthly high, low and precipitation normalThe forecast a few days before departure
Where to liveSeasonal temperatures and rainfall patternHot days, warm nights and local housing details
Whether a month was unusualThe normal for that monthHow the total was distributed across the month
When to plant outdoorsFrost and temperature normalsLocal advice and the short-range forecast

How to read one without fooling yourself

First, match the place. Airport stations, city-centre stations and nearby suburbs can have meaningfully different readings. Next, match the season: compare July with July, not with a yearly average. Finally, check the baseline period shown beside the figure. A comparison is cleanest when both cities use the same kind of measurement and the same 30-year reference period.

An average July high of 82°F does not mean every July afternoon reaches 82°F. It is the mean of daily maximum temperatures over the reference period, not the median day or a range that contains every afternoon. If a source also shows daily records, percentiles or the number of days above a chosen temperature, use those to understand the spread around the average.

Normal does not mean permanent

A normal is a benchmark, not a promise. If a city’s recent summers keep landing above its normal, that pattern is evidence worth examining. The same applies to rainfall: a monthly total can be near normal while arriving in a few heavy events rather than evenly through the month.

Updated normals can change because a newer 30-year window includes more recent weather and excludes older years. That does not invalidate the earlier number; it answers a slightly different question. When comparing an older article with current data, note the period before treating a difference as a change in the climate itself.

Use the right comparison

Compare the same month, the same measurement, and the same reference period. A July average does not explain a January cold snap, and a city’s annual rainfall total does not tell you whether its rainy season coincides with a planned trip.

What “two degrees above normal” means

As an illustrative example, suppose a station's July normal high is 28°C and its average daily high in a particular July is 30°C. That month's average high was 2°C above normal. This compares the same station, month and measurement. Comparing a single 30°C afternoon with the July average would answer a different question.

Monthly patterns reveal what annual totals hide

Imagine two cities with the same annual precipitation normal. City A receives a little rain in most months. City B has a dry season followed by a few very wet months. Their yearly totals can match, yet the experience of planning a wedding, commuting by bike or choosing a holiday month can be completely different. Monthly normals reveal that difference; the annual figure hides it.

The same principle applies to heat. Two cities might share a similar summer average high, while one cools off at night and the other stays warm after dark. Pair the average high with the average low and, where available, the count of hot days. This is more useful than choosing a city on a single headline number.

Sources and method

This guide uses the U.S. National Oceanic and Atmospheric Administration definition of a climate normal: a 30-year average for a uniform reference period. NOAA’s current official U.S. standard period is 1991 to 2020, and its dataset includes temperature, precipitation and other climate statistics from weather stations with sufficient records. For a city outside the United States, use the relevant national meteorological service and check its stated reference period.

Eranorms puts local weather history beside current conditions, so a warm day or wet month has some context. Next, see how to read average rainfall by month or compare a record high with a typical summer. For city-to-city planning, start with the city weather comparison guide.

051 / 53

Average Rainfall by Month: How to Read a City's Wet Season

Average rainfall by month tells you when a city usually receives precipitation, not whether it rains every day. A total can come from frequent light rain, a handful of thunderstorms, or one large storm. Read the monthly pattern before using it to plan a move, trip or outdoor event.

MetricWhat it tells youWhat it misses
Monthly rainfall totalHow much precipitation a month usually receivesHow many dry days it contains
Rainy daysHow often measurable rain occursWhether a few storms supply most of the total
Seasonal patternWhen wet and dry periods usually occurThe exact timing in any one year

Start with the wettest and driest months

Look for the high and low points, then ask how quickly the pattern changes. Some cities have a sharp monsoon season; others spread rainfall through the year. Two places can report the same annual total and feel completely different because the precipitation can arrive in different seasons and on different numbers of days.

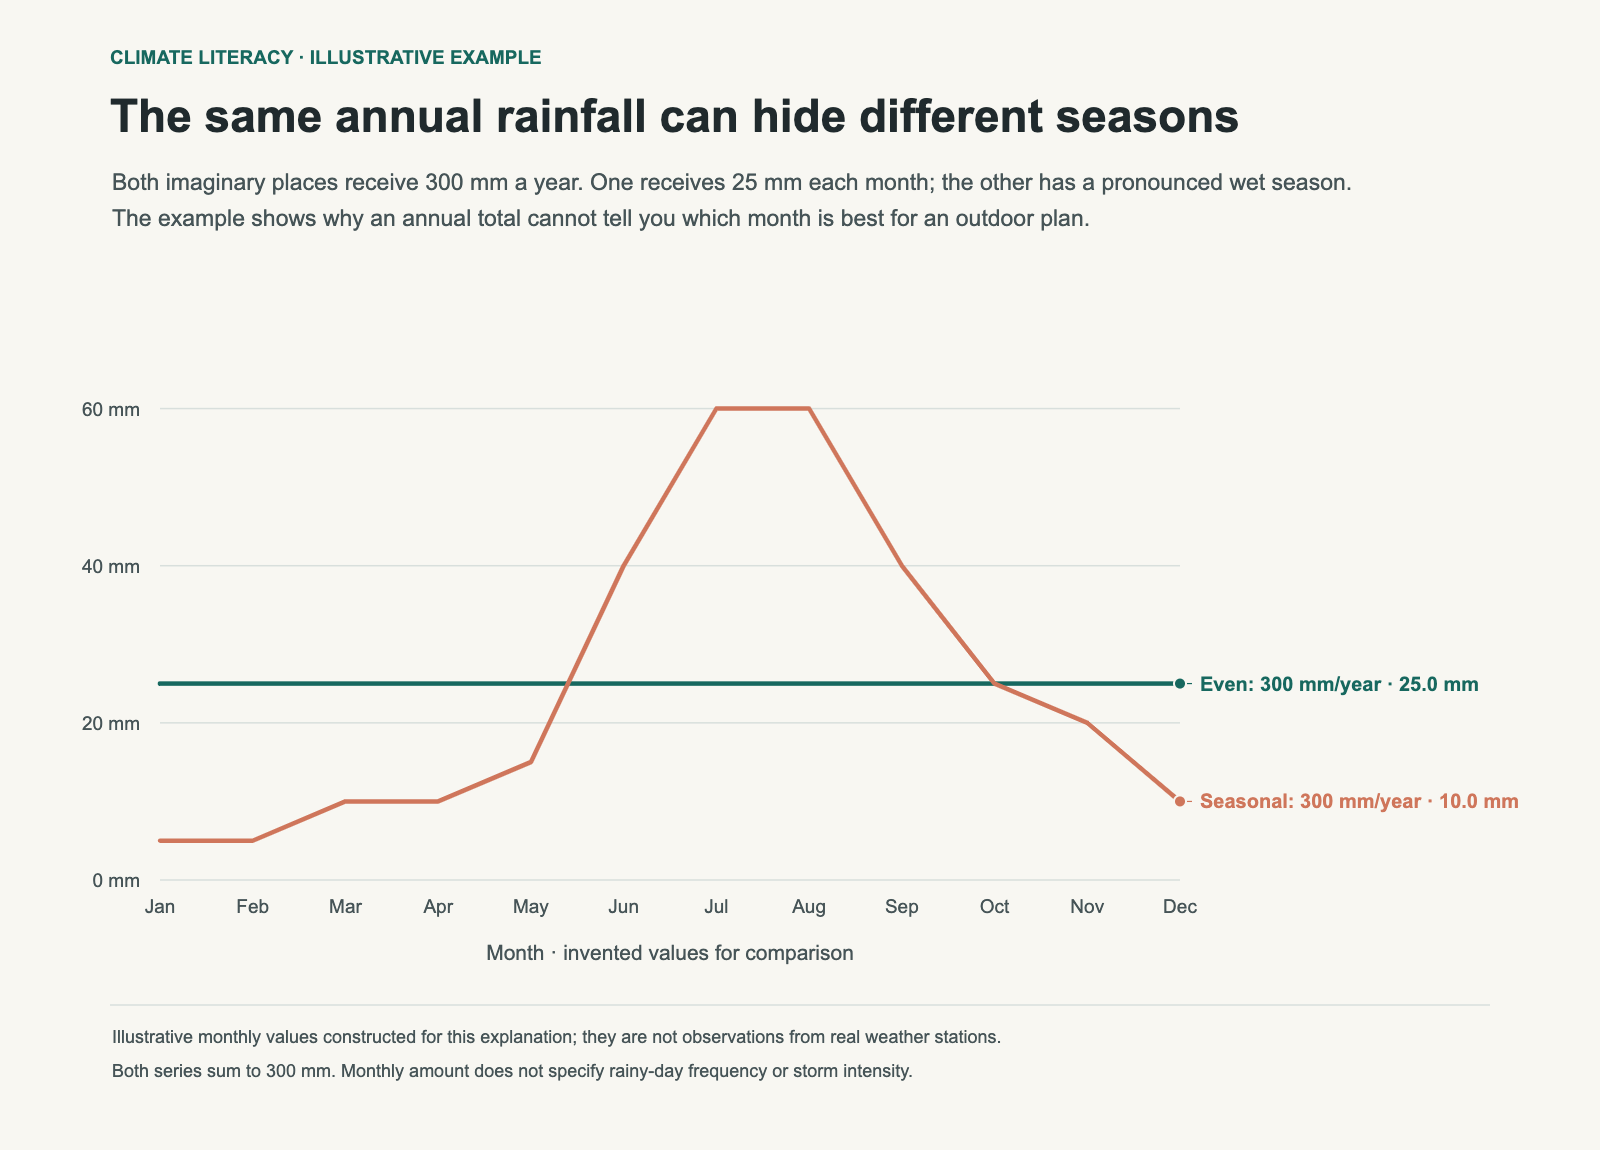
Two invented cities both receive 300 mm per year: one has 25 mm each month, the other has a strong summer peak.
Illustrative monthly totals, not observations from real cities. Both add to 300 mm a year. One spreads it evenly; the other concentrates it in a wet season. Neither line tells you how many days it rains.

Read the shape, not just the total

Find the wettest month, the driest month and the months between them. A small gap suggests fairly even precipitation. A large gap suggests a pronounced wet and dry season. Then look at the change from one month to the next. A gradual climb can make a shoulder season easy to spot; a sharp jump can matter more than the yearly average when you are booking a trip.

Pattern on the chartWhat it may mean for planning
Similar totals every monthExpect precipitation to be part of every season; check rainy-day counts for the day-to-day feel.
One or two very wet monthsThose months deserve extra attention for outdoor travel, events and drainage around a home.
Several nearly dry monthsWater use, wildfire conditions and garden choices may matter more, depending on the place.
Wet winters and dry summersSummer travel can be dry even when the city’s annual rainfall sounds high.

These are planning clues, not guarantees. Weather varies from year to year, and a normal does not state the exact number of rainy days. If that distinction matters, look for a separate rainy-day measure as well as the total. For example, 100 mm spread across twenty wet days produces a different schedule of interruptions from 100 mm over two wet days. The totals alone still cannot tell you the hourly intensity.

Pair rainfall with temperature

Rain is more useful when you read it with temperature and humidity. A wet month at 45°F calls for different plans from a wet month at 85°F. The same comparison helps with gardening, travel and the unromantic work of choosing an apartment with enough daylight.

Also check what the source means by “rainfall.” Some climate summaries use total precipitation, which can include rain and melted snow. Others report rain alone. The label matters most in places with cold winters, where a month can look wet in the records while arriving as snow rather than a rainy commute.

Put the numbers to work

For travel, compare the target month with the month immediately before and after it. That gives you a more realistic sense of whether you are choosing a dry window or merely the least-wet point in a wet season. For a move, use several years of monthly context before deciding whether a climate fits your routines. A cyclist, a parent walking to school and a gardener may all weigh the same data differently.

For an outdoor event, historical averages help with a backup plan and venue choice, but they cannot replace a forecast. Check the forecast close to the date, including wind and temperature, and use the monthly normal only as background.

Download the illustrative monthly totals. The diagram keeps the annual total fixed to isolate one difference: when precipitation arrives.

Sources and method

For U.S. locations, the monthly figures discussed here are best read as NOAA 1991 to 2020 climate-normal precipitation totals. NOAA publishes precipitation normals by station and also explains the dataset’s coverage and calculation methods. A station total can include rain and melted snow, so use the source label rather than assuming every “wet” month means rain.

Eranorms shows monthly rainfall in the context of local records. Read what climate normals mean before comparing data sources, or use the summer-heat guide to pair rainfall with temperature. The city weather comparison guide is the next step when you are weighing two places rather than one month.

052 / 53

Hottest Day on Record vs. Average Summer: What Each Number Means

A city’s hottest day on record is a memorable extreme. Its average summer temperature tells you what daily life is more likely to feel like. Both numbers matter, but they answer different questions.

MeasureUseful forLimitation
Hottest day on recordUnderstanding the outer edge of past heatOne event cannot describe a whole summer
Average high and lowComparing typical daytime and nighttime comfortIt smooths out heatwaves
Days above a thresholdEstimating how often heat disrupts plansThe threshold should fit the question

Records are useful, but easy to overread

A record high shows what has happened at least once under a particular set of conditions. It does not mean every summer day is close to that number. A city with a dramatic record can still have mild typical summers; another city can have a lower record but many more days of sustained heat.

A record is the highest observed value in the available history. It is not a physical ceiling: a later event can exceed it. It can be relevant for emergency planning, building design and curiosity about local extremes. It is a poor shortcut for deciding how often you will need air conditioning, whether evenings are comfortable, or when a midday walk becomes unpleasant. Those questions need typical highs, lows and the frequency of hot days.

A lower record can still accompany more hot days

Consider an invented comparison. City A has a record of 42°C but averages five days above 35°C in a summer. In City B, the record is 40°C and the average is twenty-five days above 35°C. The higher observed extreme belongs to A; more frequent days above that threshold occur in B. Your decision about routine afternoon plans may depend more on the second measure.

Compare a complete summer profile

Start with the average high for the month you care about. Add the average low, then look for the number of days above a threshold that matters to you. Someone who finds 90°F difficult should compare days above 90°F; someone worried about freezing conditions needs a different threshold. There is no universal comfort number.

QuestionMost useful measureWhy
How hot are typical afternoons?Average monthly highIt describes the usual daytime baseline.
Will the home cool down overnight?Average monthly low and warm-night countsNighttime heat affects sleep and recovery.
How often will heat change plans?Days above a chosen thresholdFrequency is more actionable than one record.
How extreme has it been in this record?Record high, read with its date and stationIt gives context for rare past conditions.

Check the overnight low

Nighttime temperature changes how a heatwave feels. A hot afternoon followed by a cool night is different from several days when the temperature barely drops after sunset. When comparing cities, look at average lows and the frequency of warm nights alongside average highs.

Location within a metro area can matter too. An official station may sit at an airport, in a park or outside the densest neighbourhoods. Shade, pavement, elevation and nearby water can affect the conditions a person experiences. Use the station data for a consistent comparison, then check neighbourhood-level details before treating a city-wide value as the temperature outside a particular apartment.

Do not confuse a hot summer with a long-term baseline

A single hot summer can be memorable without defining every future summer. Likewise, a climate normal smooths over heatwaves and cool spells by design. Read both together: recent conditions show what has happened lately, while a multi-decade normal supplies a reference point. If the question is whether a particular month ran warm, compare that month with its normal rather than with the all-time record.

Humidity, wind and sun exposure can also change how heat feels, even when the air temperature is the same. They are useful additions to a practical plan, but they do not replace the core temperature measures. Keep the comparison simple at first, then add the factor that matches your decision.

Ask a practical question

For travel, compare the average high, average low and monthly rainfall. For a move, add the number of hot days and the shape of the trend over time. For a heatwave, use the forecast and local public-health guidance. Each question needs a different measure.

A simple city comparison can fit on one note. Write down the target month, average high, average low, days above your threshold and monthly precipitation for each city. Then add the record high in a separate column, clearly labelled as an extreme. This keeps the record from quietly becoming the headline number in a decision about ordinary life.

Sources and method

For U.S. cities, confirm a record at the reporting station and keep its date with the number. NOAA’s Climate Data Online provides historical station observations, while the 1991 to 2020 Climate Normals dataset supplies a consistent reference for typical monthly conditions. An airport record does not describe the temperature at every address in a metro area.

Eranorms makes it easier to place a record day beside decades of weather history. Read what climate normals mean for the baseline behind a comparison, and add monthly rainfall when the decision involves travel or a move. The companion post, What Climate Stripes Actually Show You, explains how longer trends differ from a single record.

053 / 53

What Climate Stripes Actually Show You

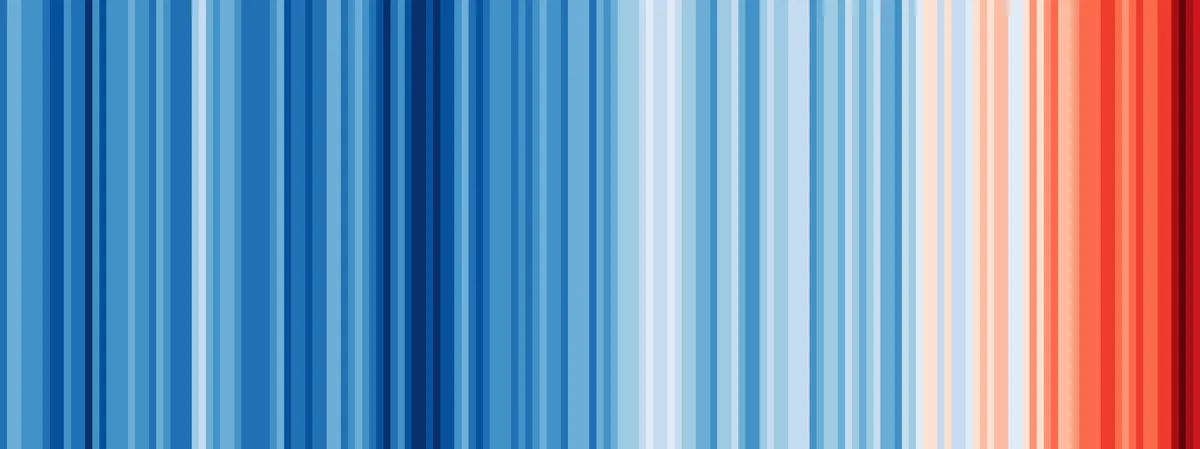
Climate stripes show one year per vertical band, coloured by how warm or cool that year was relative to a stated baseline. They are a compact way to show a long temperature record. They do not show a forecast, a daily temperature range or the cause of a particular heatwave.

Warming stripes graphic depicting annual mean global temperatures from 1850 to 2018
Global annual mean temperature anomalies from 1850 to 2018, visualized as warming stripes. (Graphic: Ed Hawkins, University of Reading, CC BY-SA 4.0 via Wikimedia Commons)

Each stripe is an anomaly, not an absolute temperature

Blue does not mean a cold winter, and red does not mean a hot summer. A stripe describes the annual average relative to its own baseline. The University of Reading’s original global graphic uses the 1961 to 2010 average. A city graphic can use a different baseline, so compare two stripe charts only after checking their source and reference period.

  • Blue: a year below the chart’s baseline.
  • Neutral: a year close to the baseline.
  • Red: a year above the baseline.

Read a colour as a difference from the baseline

In a hypothetical example, an annual mean of 14.4°C against a baseline mean of 13.8°C produces an anomaly of +0.6°C. The stripe represents that difference. It does not mean the year was 0.6°C in absolute terms, nor that every season was warmer by the same amount.

Check the colour scale as well as the baseline. Two charts can assign the same red to different anomaly values. Without matched scales, darker red in one city does not prove it warmed more than another city.

What a local chart can and cannot show

Local stripes can reveal whether recent years tend to sit above or below a location’s historical baseline. They do not show why the pattern occurred, how much rain fell, or what an individual neighbourhood felt like. Station location, record length, data processing and baseline selection all affect a local chart. Read those details before treating a colour pattern as a precise city-wide measurement.

Use stripes with the numbers behind them

Read the stripe chart with the annual temperature series, the baseline period and the station or area represented. For a practical decision, compare monthly highs and lows, precipitation and the number of hot days. Those measures answer questions about a trip or move more directly than colour alone.

Sources and method

The warming-stripes graphic above is credited in its caption. Professor Ed Hawkins created climate stripes at the University of Reading in 2018; the university explains that each original global stripe represents one year relative to the 1961 to 2010 average. For U.S. station and normal data, use NOAA’s Climate Data Online and 1991 to 2020 Climate Normals datasets.

Eranorms lets you explore weather history beside a current observation. For the baseline behind a stripe chart, read what climate normals mean. For the practical side of a comparison, see record heat versus a typical summer and average rainfall by month.