YellowSquared  /  Field notes

Notes from the workshop

53 posts, newest first. Choose an app to narrow the feed.

001 / 53

What Is a Temperature Inversion, and Why Does It Trap Winter Smog and Fog in Valleys?

On a clear winter morning in a mountain basin, you can often see a sharp, flat gray ceiling of haze sitting halfway up the surrounding peaks while the ski resorts above bask in bright sunshine. That atmospheric lid is a temperature inversion—a reversal of the normal vertical temperature profile of the lower atmosphere.

As documented in Inversion (meteorology), Smog, and the Twenty-Year Review of Outdoor Air Quality in Utah (MDPI), inversions suppress vertical mixing and allow fine particulates (PM2.5) to spike well past federal health limits. Track live local air quality, temperature, and inversion conditions in Eranorms when planning outdoor runs or commutes.
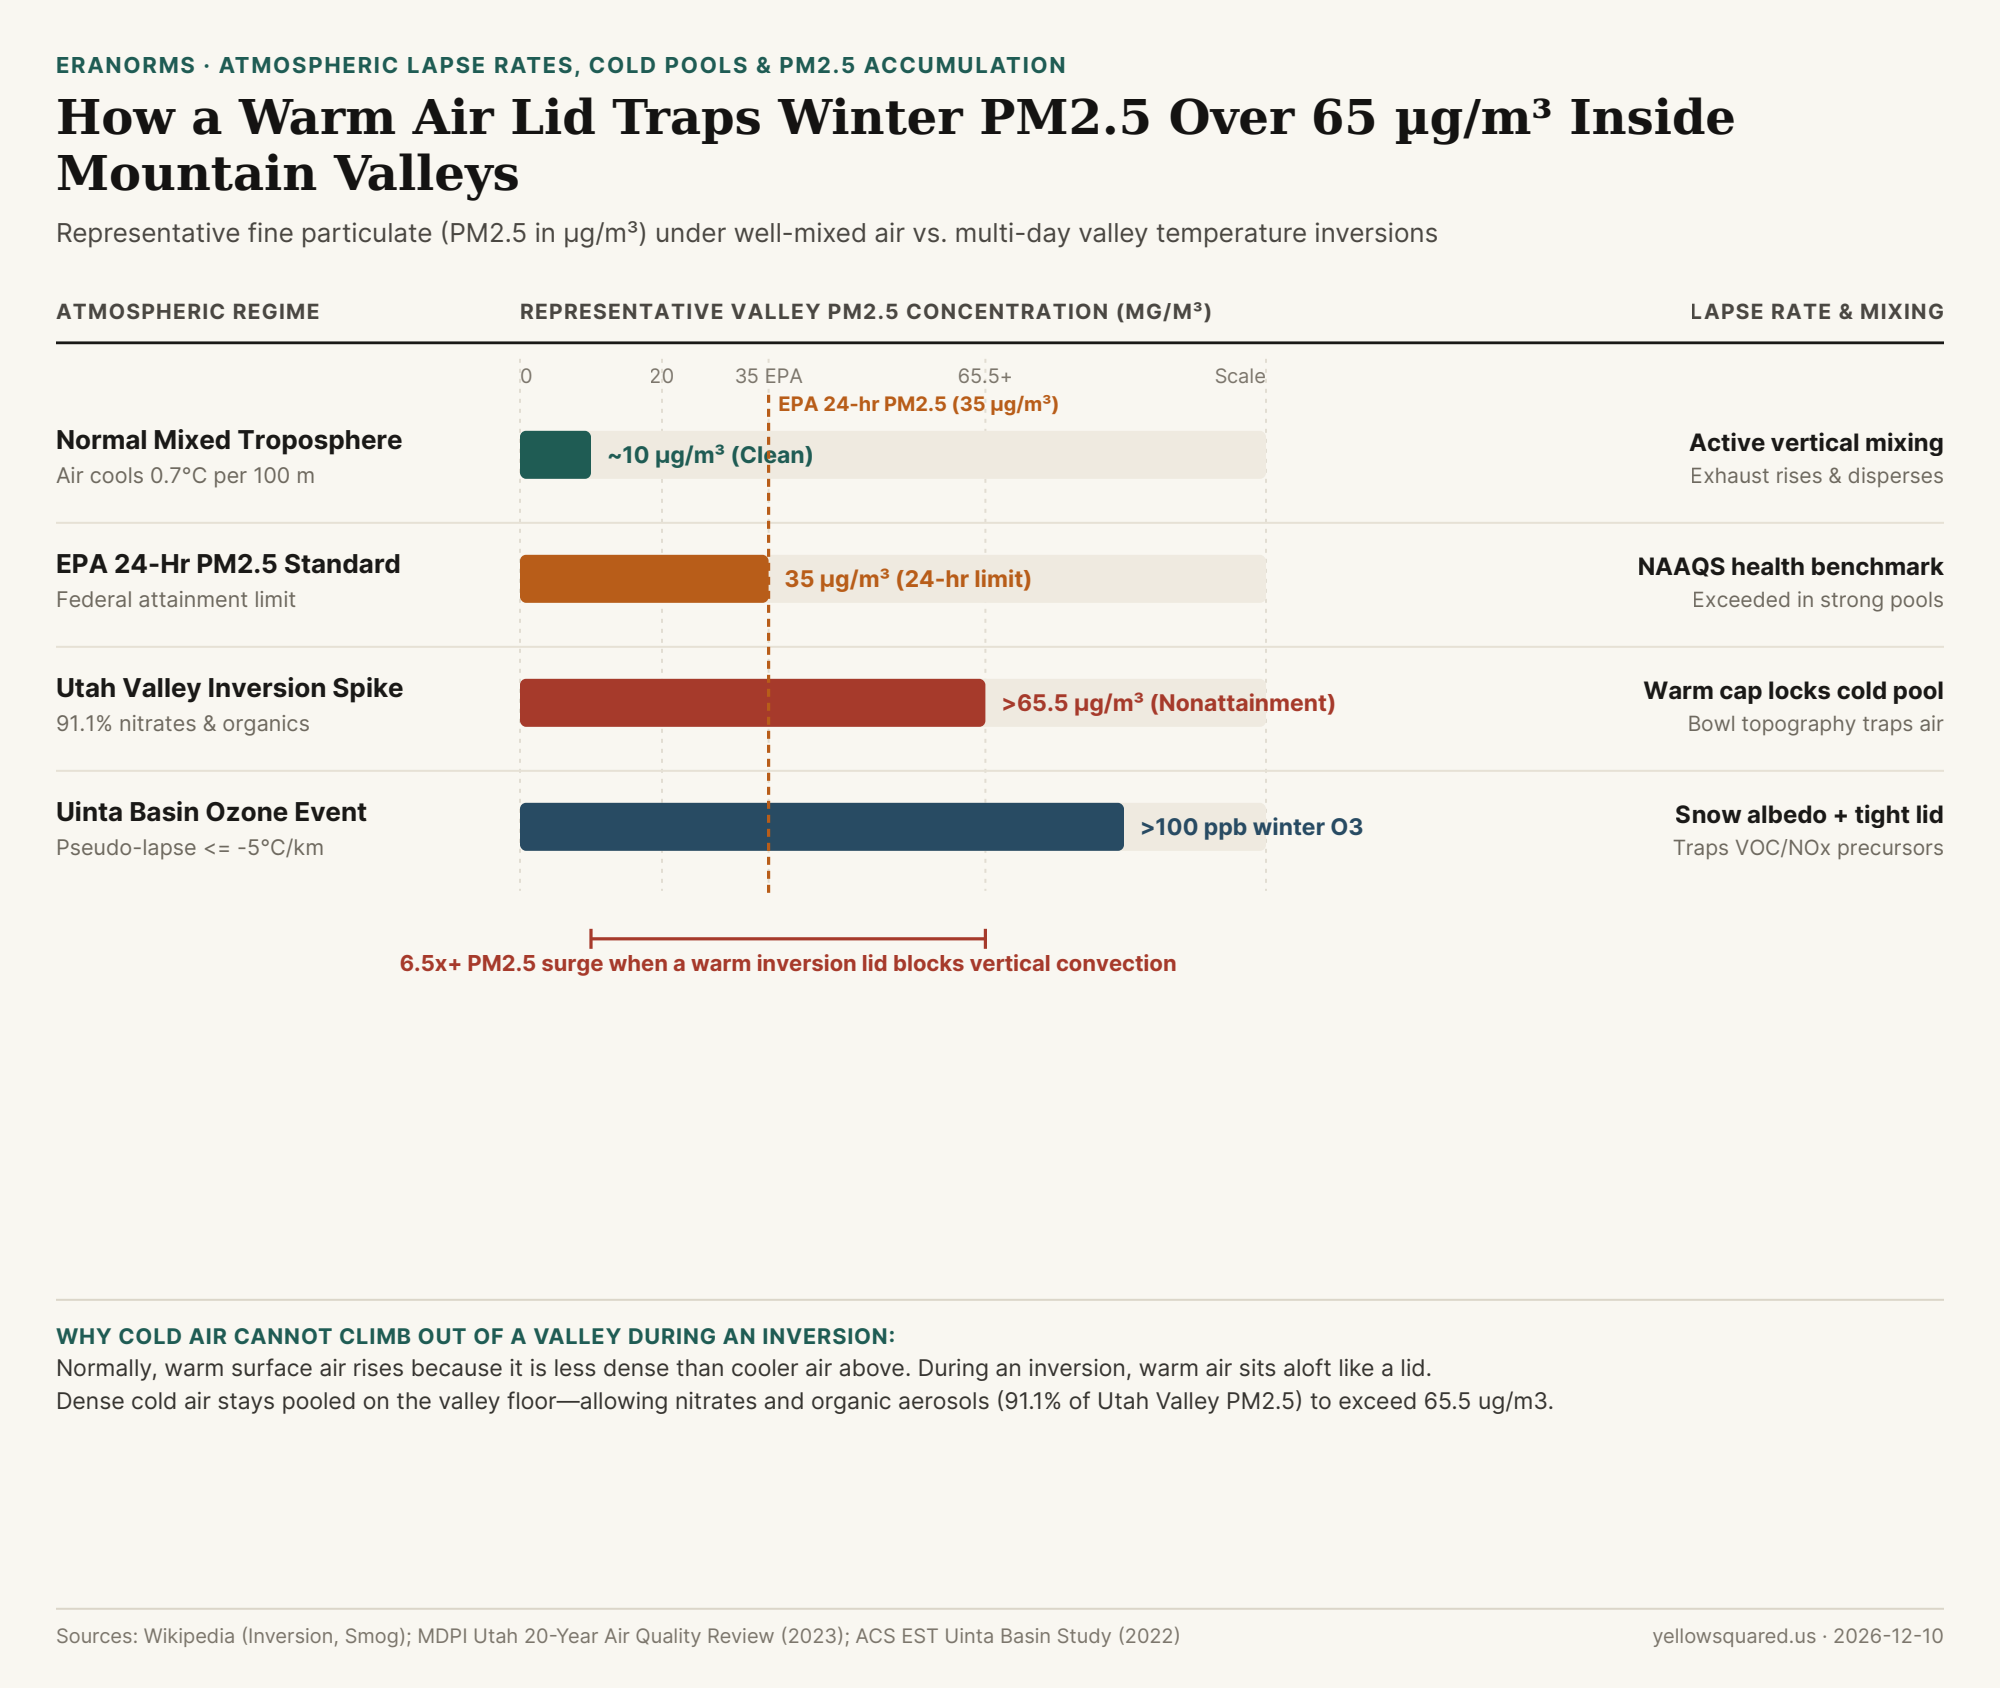
Horizontal comparison chart showing valley PM2.5 levels under normal mixed air (~10 ug/m3), the EPA 24-hour standard (35 ug/m3), and Utah Valley inversion spikes (>65.5 ug/m3).
Figure 1: Representative fine particulate (PM2.5 in µg/m³) under well-mixed conditions vs. valley temperature inversions. Sources: Inversion (meteorology) and MDPI Utah Air Quality Review · Download CSV dataset.

Normal Lapse Rate vs. Inverted Warm Lid

  • Normal Mixing: Because the sun heats the ground from below, tropospheric air normally cools with height (around 0.7°C per 100 m). Warm air near the surface is buoyant, rising through cooler air above and dispersing vehicle exhaust and woodsmoke.
  • Radiation & Subsidence Inversions: On calm, clear winter nights, snow-covered ground radiates heat rapidly into space, chilling the bottom layer of air while warmer air—often reinforced by sinking high-pressure subsidence—sits aloft. Because cold air is denser than warm air, it cannot rise through the warm cap.

"During Utah Valley winter inversions, nitrates and organic aerosols account for 91.1 percent of PM2.5 mass—driving concentrations past 65.5 µg/m³ beneath a warm atmospheric lid."

Why Bowl-Shaped Valleys Hold Smog for Days

In mountain basins such as Salt Lake Valley, Cache Valley, Los Angeles, and Almaty, surrounding ridges block horizontal winds while the inversion lid blocks vertical convection. Worse, bright snowpack reflects incoming sunlight instead of warming the valley floor—meaning a strong cold pool can persist until a passing storm front scours out the basin.

Atmospheric Regimes & Air Quality Impact Table

Compare normal mixing against three common inversion patterns (download the raw CSV dataset):

Atmospheric Regime Altitude Temp Trend Vertical Mixing Valley Air Quality Impact
Normal Troposphere Cools ~0.7°C / 100 m Active convection Baseline ~10 µg/m³ PM2.5
Nocturnal Radiation Cap Warms near surface Suppressed overnight Morning valley fog & woodsmoke
Multi-Day Cold Pool Pseudo-lapse <= -5°C/km Locked basin air PM2.5 >65.5 µg/m³ (exceeds EPA 35)
Subsidence Marine Cap Sinking air warms aloft Capped marine layer Coastal stratus & summer smog

002 / 53

What Is a Haboob Dust Storm, and Why Do Thunderstorm Outflows Trigger Miles-Wide Walls of Dust?

Every summer during the North American monsoon—and across the Sahara, the Arabian Peninsula, and interior Australia—social media fills with dramatic footage of a towering, miles-wide wall of reddish-tan dust rolling across desert highways at sunset. Meteorologists call this phenomenon a haboob (from the Arabic root habb, meaning "to blow"). Unlike ordinary windstorms driven by large-scale regional pressure gradients, a haboob is an atmospheric density current triggered by the collapse of a thunderstorm.

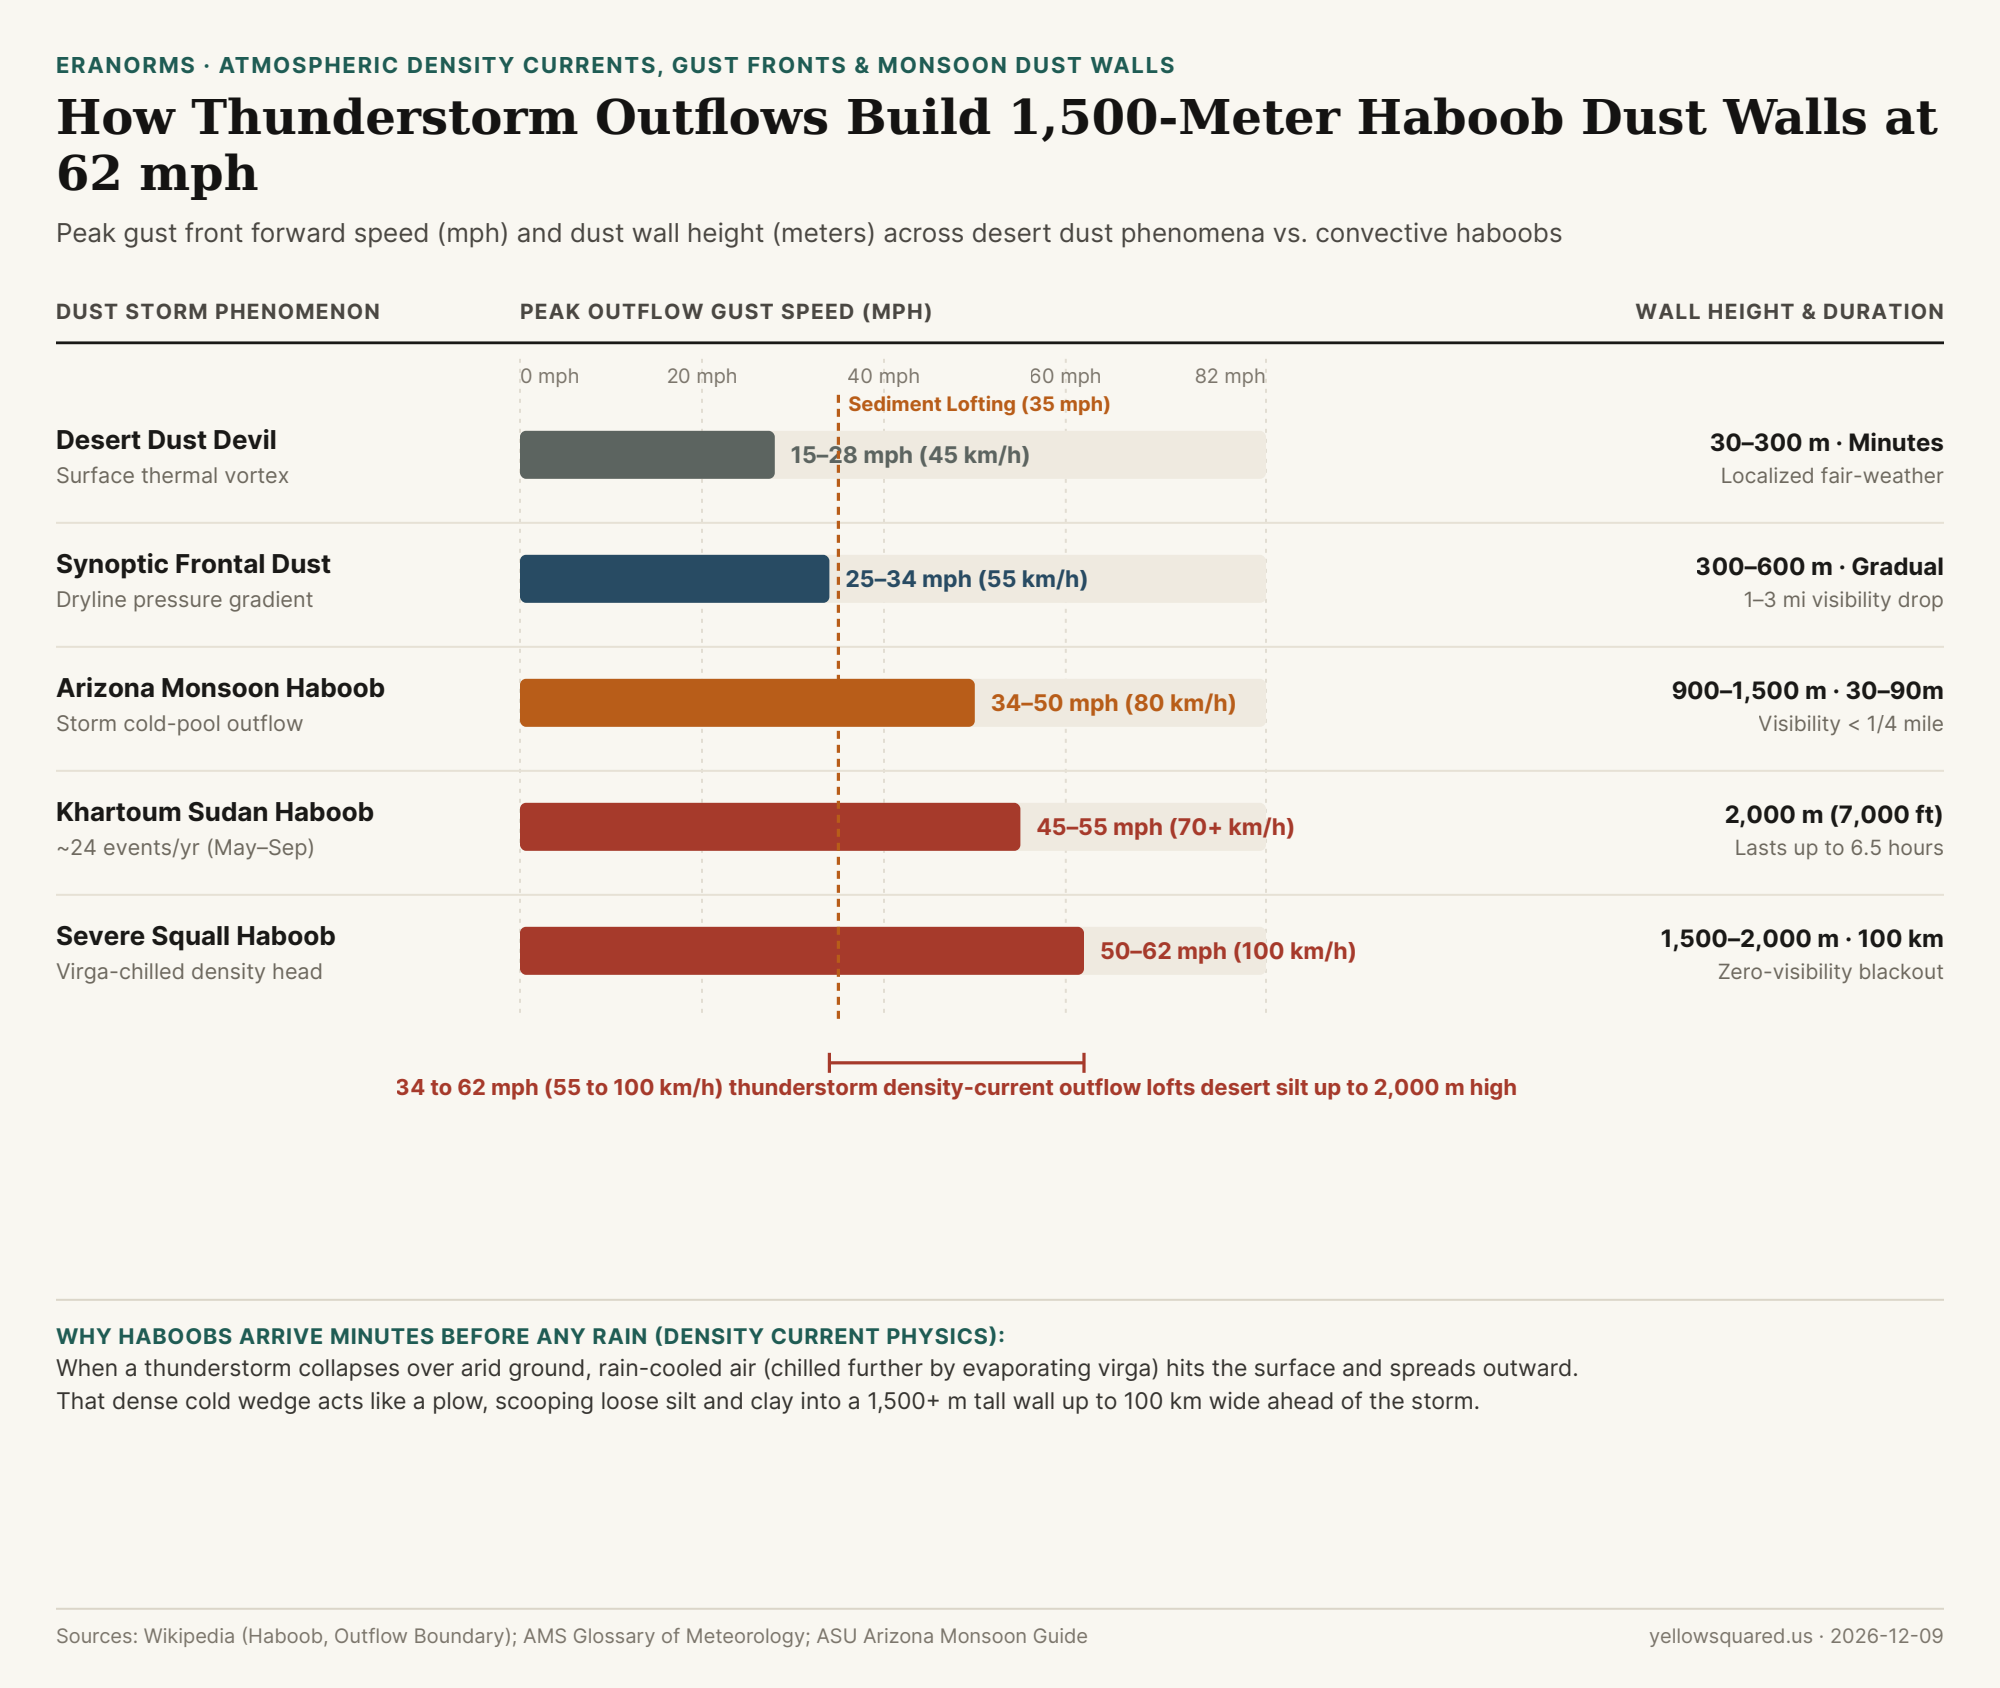
As defined in the American Meteorological Society (AMS) Glossary of Meteorology, Haboob storm mechanics, and Arizona State University's desert monsoon guide, a haboob can loft fine silt and clay 1,500 to 2,000 meters (5,000 to 7,000 feet) into the sky and race outward at 35 to 62 mph (55 to 100 km/h)—often arriving minutes before any rain falls. Compare seasonal monsoon humidity, wind, and temperature normals in Eranorms to see when arid regions enter peak haboob season.

Horizontal comparison chart showing peak outflow gust speeds in mph and dust wall heights from desert dust devils (15-28 mph) and frontal dust (25-34 mph) up to Arizona monsoon haboobs (34-50 mph) and severe squall haboobs (50-62 mph).
Figure 1: Peak outflow gust speed (mph) and dust wall height (meters) across desert dust regimes, showing how thunderstorm cold-pool density currents generate towering haboobs. Sources: Haboob (Wikipedia), AMS Glossary of Meteorology, and ASU Monsoon Guide · Download CSV dataset.

The 3-Stage Engine: Downdraft → Cold Pool → Density Current

Why does a haboob look like a solid, churning cliff of dirt rather than a diffuse haze? As documented in Outflow boundary physics, the secret is density:

  1. Evaporative Chilling Aloft: As a mature desert thunderstorm begins to rain, much of that precipitation falls into hot, dry sub-cloud air and evaporates mid-air (virga). Evaporation absorbs massive latent heat, chilling the descending column of air by 10°C+ compared to the surrounding desert air.
  2. Ground Impact & Outflow Surge: Because cold air is denser than warm air, the chilled downdraft plunges to the desert floor and spreads horizontally outward in all directions—creating a leading edge called a gust front or outflow boundary.
  3. The Density-Current Head: Like a heavy wedge of cold ocean water sliding beneath warm surface water, the leading "head" of the cold outflow lifts warm air sharply upward while turbulent winds of 35 to 62 mph behind it scour loose silt, clay, and sand off dry lakebeds and desert scrub, rolling the sediment upward into a sharp, billowing wall up to 100 km (62 miles) wide.

"In Khartoum, Sudan—where the term haboob originated—monsoon thunderstorm outflows average roughly 24 haboobs per year between May and September, reaching 2,000 meters (7,000 feet) high and lasting up to 6.5 hours."

Haboob vs. Dust Devil vs. Frontal Dust Storm Table

The table below compares atmospheric drivers, wall heights, peak gust speeds, and highway visibility impacts across five desert dust regimes (download the raw CSV dataset):

Dust Phenomenon Atmospheric Driver Typical Wall Height Gust Speed (mph) Duration & Visibility Impact
Desert Dust Devil Local solar surface heating vortex 30 to 300 m 15 to 28 mph Minutes; narrow localized swirl < 50 m wide
Dryline / Cold Front Dust Synoptic pressure gradient 300 to 600 m 25 to 34 mph Hours; gradual visibility drop to 1–3 miles
Arizona Monsoon Haboob Thunderstorm cold-pool outflow 900 to 1,500 m 34 to 50 mph 30–90 min; abrupt wall drops visibility < 0.25 mi
Khartoum Sudan Haboob Tropical squall density current 2,000+ m (7,000 ft) 45 to 62 mph Up to 6.5 hours; ~24 events/year
Severe Squall Haboob Multi-cell gust front + virga 1,500 to 2,000 m 50 to 62 mph Up to 100 km wide; zero-visibility blackout

Highway Safety Rule Inside a Haboob

As emphasized by desert weather safety advisories, if you are driving when a haboob approaches, never stop in a travel lane: pull completely off the highway shoulder, set your parking brake, turn off all headlights and taillights, and take your foot off the brake pedal so trailing drivers do not mistakenly follow your lights off the road into a rear-end collision. Compare seasonal monsoon humidity, wind, and temperature normals in Eranorms to check dry-season and monsoon wind windows before desert road trips.

003 / 53

What Is Virga, and Why Does Evaporating Rain Trigger Dangerous Dry Microburst Winds?

Across the American Southwest, the High Plains, and interior Australia, summer afternoon clouds frequently trail wispy, comma-shaped curtains of precipitation that vanish in mid-air thousands of feet above the ground. In atmospheric science (as defined in the NOAA National Weather Service Glossary of Convective Storms and Glossary of Meteorology), these evaporating precipitation shafts are called virga. While a vanishing rain shower looks harmless from a distance, the phase change happening inside that virga shaft can trigger one of aviation and desert meteorology's most hazardous phenomena: a dry microburst capable of producing straight-line surface winds of 25 to 58 m/s (56 to 130 mph) without a single drop of rain reaching the ground.

Why does disappearing rain generate destructive wind gusts? As documented in convective research on dry downbursts and negative buoyancy and thermodynamic constants in the Scio.ly Meteorology Study Guide, evaporating water and sublimating ice extract massive quantities of latent heat directly from the mid-tropospheric air column. Compare seasonal humidity, temperature, and precipitation normals in Eranorms to see where high afternoon temperatures and low afternoon dew points create prime dry-microburst climatologies.

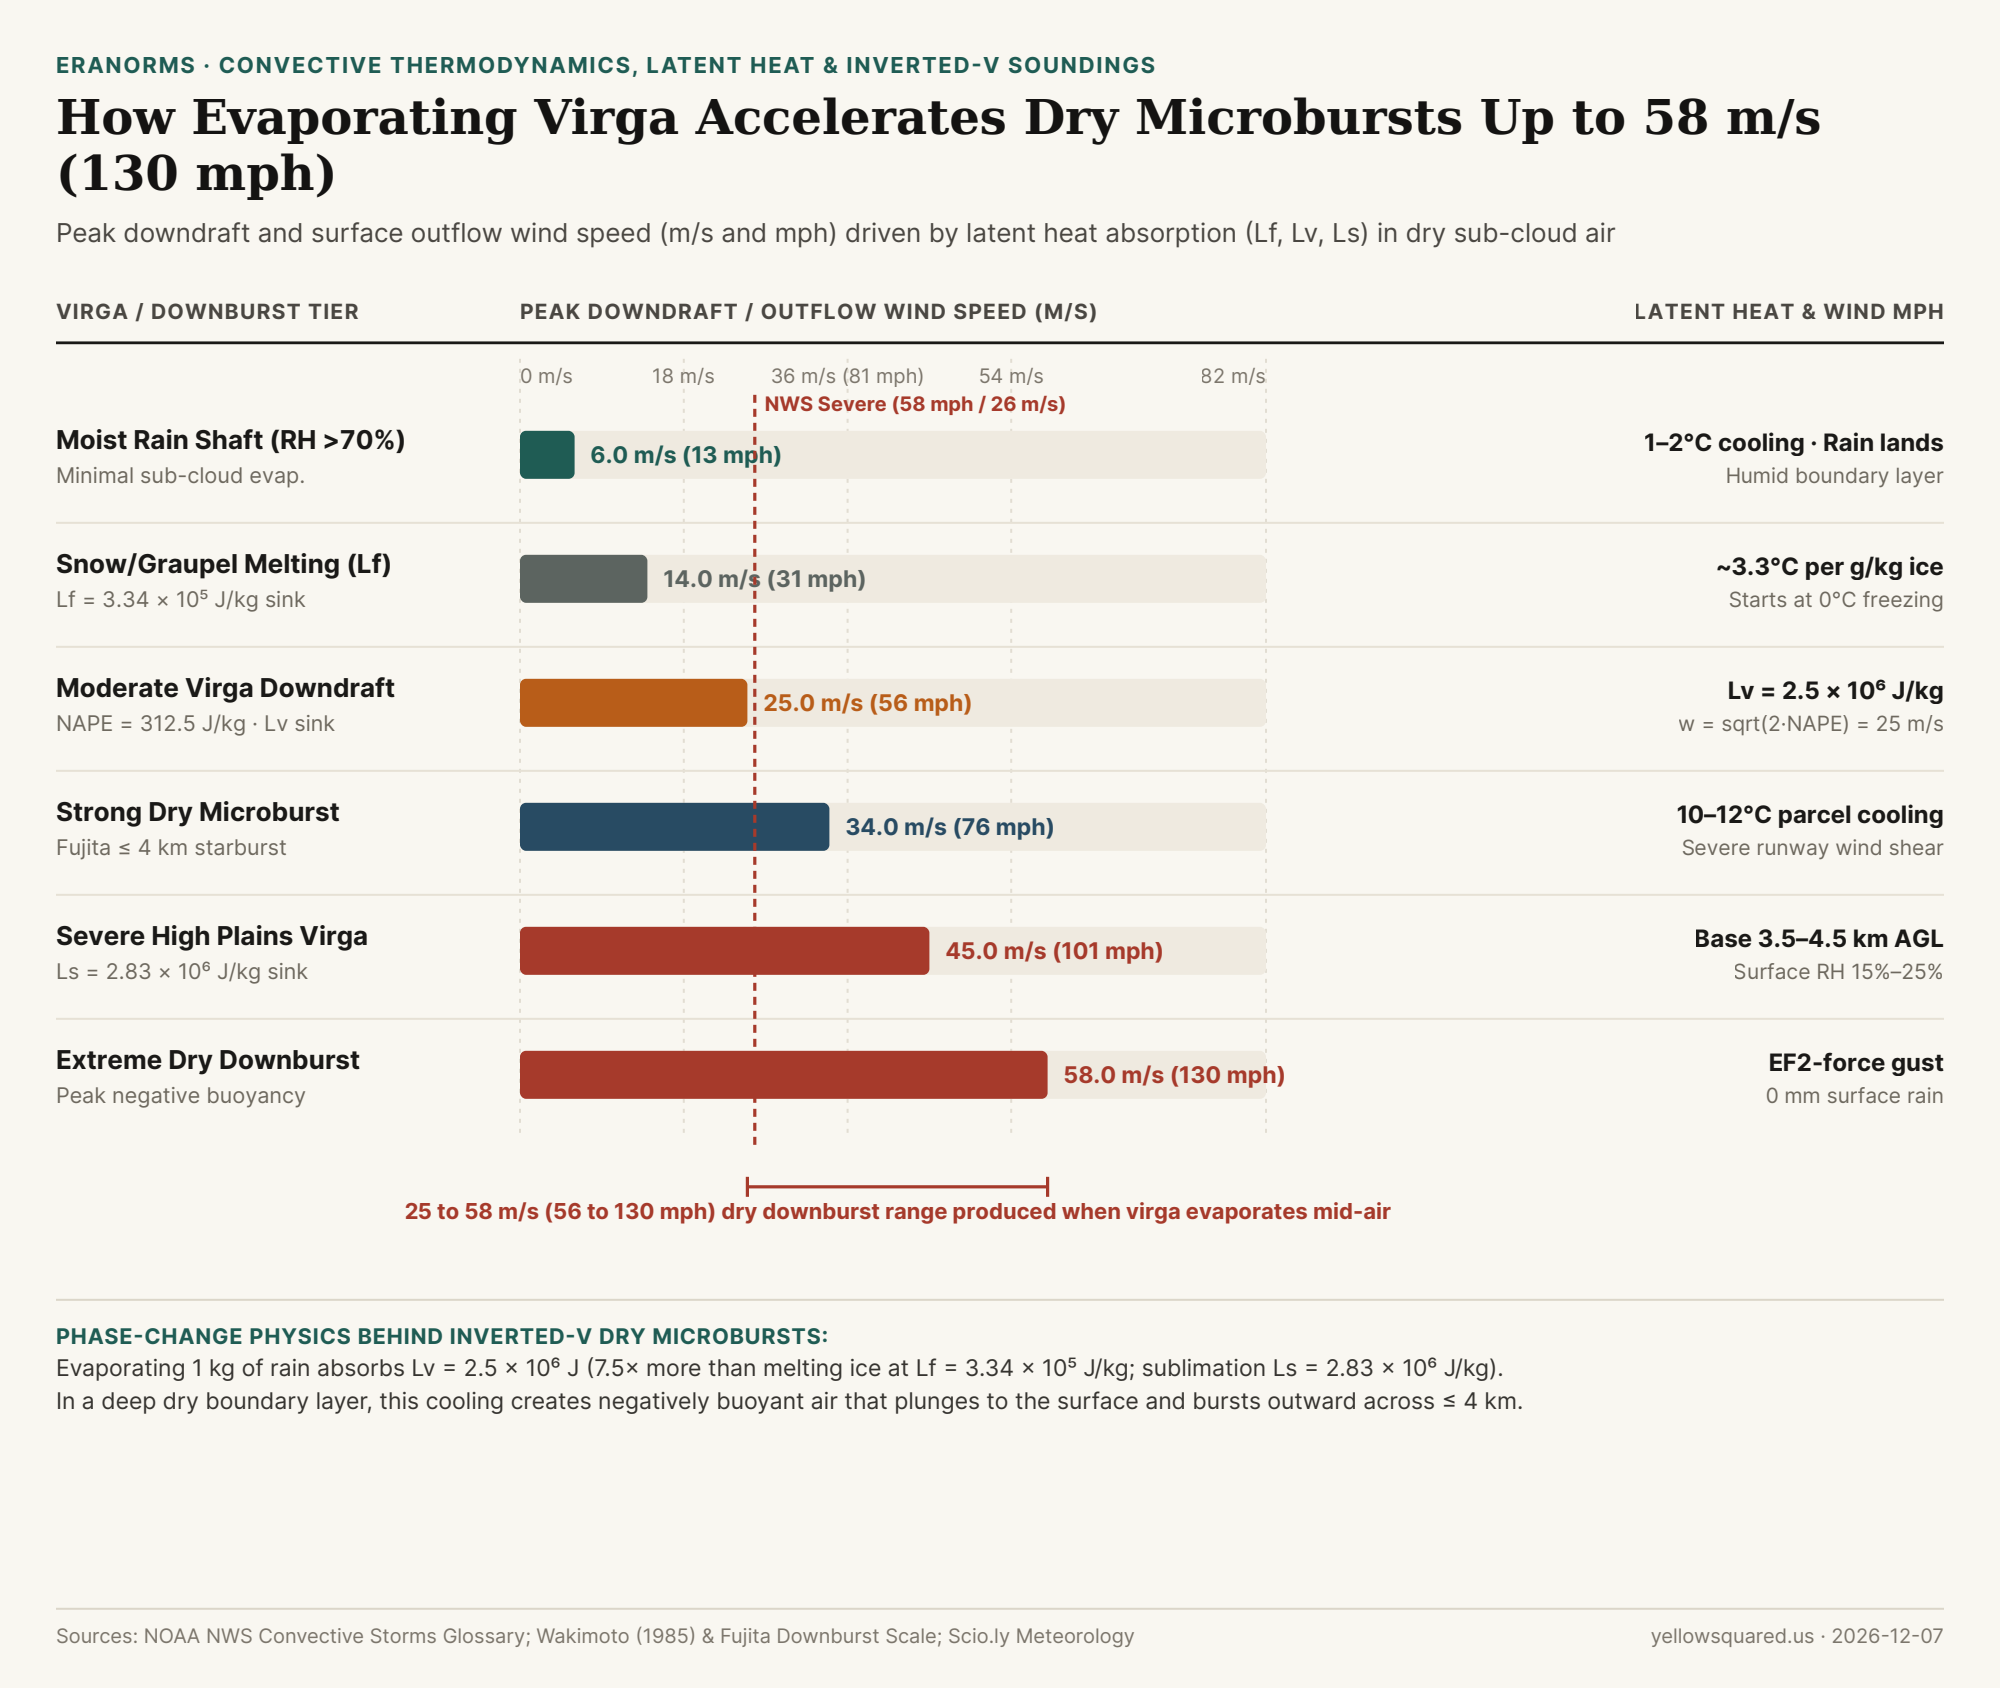
Horizontal bar chart comparing peak downdraft and surface outflow wind speeds from 6 m/s in a moist rain shaft to 58 m/s (130 mph) in an extreme dry downburst driven by virga latent heat absorption.
Figure 1: Peak downdraft and surface outflow wind velocity (m/s and mph) across six convective regimes, illustrating how latent heat of fusion (L_f), vaporization (L_v), and sublimation (L_s) drive dry microbursts. Sources: Downburst Thermodynamics, Scio.ly Meteorology Constants, and NOAA NWS Glossary · Download CSV dataset.

The Thermodynamics of Phase Change: L_f, L_v, and L_s

When precipitation falls from a high-based cumulus or cumulonimbus cloud (typically 3,000 to 4,500 meters / 10,000 to 15,000 feet above ground level) into a deep, dry, well-mixed sub-cloud layer (surface relative humidity 15%–25%), the energy required to turn ice and liquid water into water vapor is drawn directly from the sensible heat of the surrounding air parcel:

  • Latent Heat of Fusion (L_f = 3.34 × 10⁵ J/kg): As snow and graupel descend below the freezing level (0°C), melting absorbs 334,000 joules per kilogram of ice. Because dry air has a specific heat at constant pressure of c_p = 1,005 J/(kg·°C), melting just 1 g of ice per kilogram of dry air cools the air parcel by roughly 0.33°C.
  • Latent Heat of Vaporization (L_v ≈ 2.50 × 10⁶ J/kg): As liquid raindrops evaporate into dry sub-cloud air, every kilogram of water absorbs 2.5 million joules—roughly 7.5 times more thermal energy than melting ice. Evaporating 3 g of rain per kilogram of dry air chills the parcel by ~7.5°C.
  • Latent Heat of Sublimation (L_s ≈ 2.83 × 10⁶ J/kg): When ice crystals sublimate directly into vapor in bone-dry mid-level air, the combined energy sink reaches 2.83 million joules per kilogram.

"In a classic 'inverted-V' sounding, the sub-cloud layer follows a steep dry-adiabatic lapse rate (9.8°C/km). As virga evaporates into that layer, the chilled air parcel stays colder and denser than its surroundings all the way to the ground—accelerating downward like an invisible waterfall of cold air."

From Negative Buoyancy (NAPE) to 130 mph Starburst Winds

In vertical momentum physics, the downward acceleration of an evaporatively cooled air parcel is governed by its Negative Available Potential Energy (NAPE)—the vertically integrated negative buoyancy from the cloud base to the ground:

w_max = sqrt(2 × NAPE)

As shown in downburst buoyancy derivations, even a moderate negative buoyant energy of NAPE = 312.5 m²/s² (J/kg) accelerates a descending column to w_max = sqrt(2 × 312.5) = 25.0 m/s (56 mph / 90 km/h). When that dense cold column hits the ground, it cannot penetrate the surface; instead, it splashes radially outward in all directions across a localized starburst footprint defined by storm researcher Ted Fujita as <= 4 km (2.5 miles) in diameter for a microburst (and > 4 km for a macroburst).

Reproducible Virga & Dry Microburst Regimes Table

The table below compares the latent heat mechanism, sub-cloud parcel cooling, and resulting downdraft/outflow wind speeds across six convective profiles (download the raw CSV dataset):

Convective / Virga Regime Dominant Phase-Change Sink Sub-Cloud Parcel Cooling Peak Wind (m/s) Peak Wind (mph) Surface Signature & Aviation Hazard
Moist Synoptic Rain Shaft RH > 70% (Minimal evaporation) 1°C to 2°C 6.0 m/s 13 mph Steady rain reaches surface; benign wind shift
Snow & Graupel Melting Layer L_f = 3.34 × 10⁵ J/kg ~3.3°C per 10 g/kg ice 14.0 m/s 31 mph Initiates negative buoyancy at the 0°C melting level
Moderate Virga Downdraft L_v = 2.50 × 10⁶ J/kg (NAPE = 312.5) 6°C to 8°C 25.0 m/s 56 mph Rain vanishes aloft; blowing dust ring at surface
Strong Dry Microburst (<= 4 km) Combined L_f + L_v sink 10°C to 12°C 34.0 m/s 76 mph Exceeds NWS severe thunderstorm wind threshold (58 mph)
Severe High Plains Virga L_s = 2.83 × 10⁶ J/kg sublimation 12°C to 15°C 45.0 m/s 101 mph High base (3.5–4.5 km) over 15%–25% RH boundary layer
Extreme Straight-Line Downburst Maximum sub-cloud collapse > 15°C density drop 58.0 m/s 130 mph EF2-equivalent wind damage with 0 mm surface rainfall

How to Spot a Dry Microburst on the Trail or Runway

Because dry microbursts contain no heavy rain core to show up brightly on standard weather radar reflectivity, your best visual warning is the combination of wispy virga shafts overhead and an expanding ring of blowing dust (a curl or rotor cloud) along the ground. Whenever afternoon temperatures exceed your dew point by more than 25°C (45°F) under high-based convective clouds, secure tents, canopies, and light aircraft long before the virga passes overhead. Compare seasonal humidity, temperature, and precipitation normals in Eranorms to inspect historical afternoon dew-point spreads and dry-season wind risks for any destination.

004 / 53

Why Do Deserts Get So Cold at Night After Reaching 100°F During the Day?

First-time campers in the Mojave, Sahara, or Atacama deserts are often shocked by how rapidly a blistering 38°C (100.4°F) afternoon collapses into shivering 10°C to 16°C (50°F–61°F)—or even sub-freezing -4°C (25°F) winter nights—within hours of sunset. While humid tropical islands and coastal cities barely cool by 2.5°C to 7.0°C (4.5°F–12.6°F) overnight, arid deserts routinely experience a Diurnal Temperature Range (DTR = T_max − T_min) of 21.5°C to 25.5°C (38.7°F to 45.9°F). As explained in atmospheric heat-transfer analyses of planetary radiative cooling, Harvard LabXchange's desert thermodynamics brief, and arid climate meteorology, this extreme swing is driven by the intersection of ground specific heat capacity and the water-vapor infrared greenhouse window.

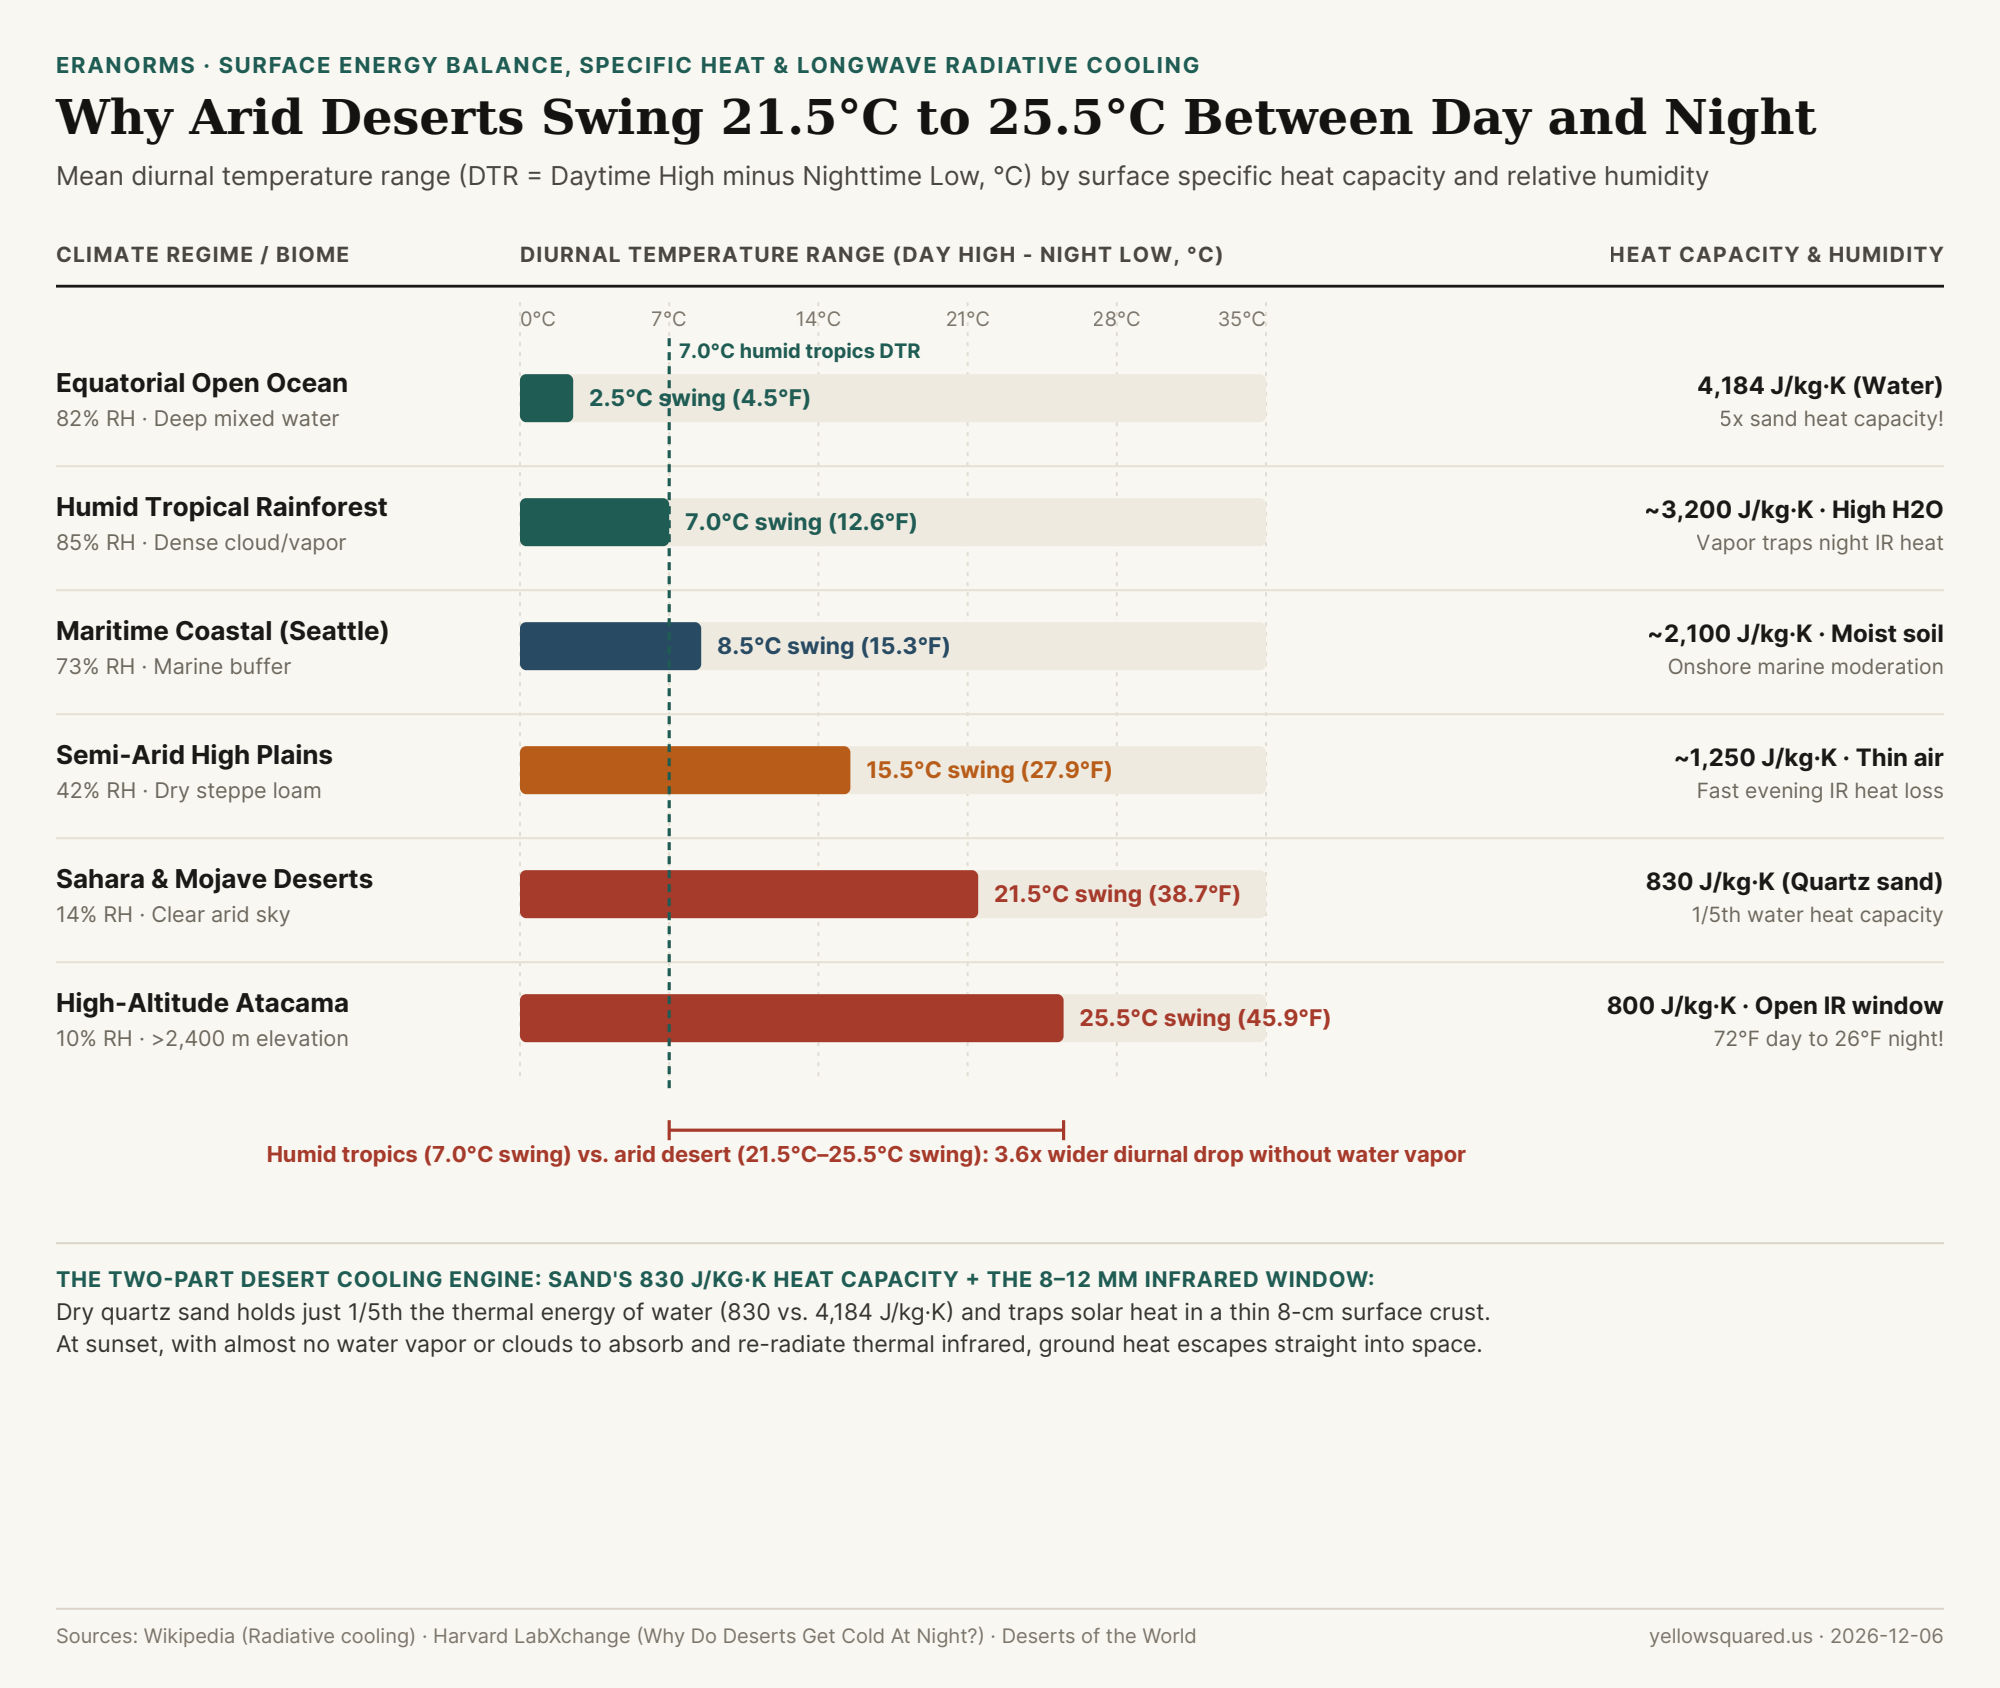
Chart comparing diurnal temperature range in degrees Celsius across equatorial ocean, humid rainforest, maritime coast, semi-arid steppe, Sahara/Mojave deserts, and high-altitude Atacama
Figure 1: Mean Diurnal Temperature Range (DTR, daytime high minus nighttime low in °C) alongside surface specific heat capacity (J/kg·K) and relative humidity across six global climate regimes. Data: Wikipedia (Radiative cooling), Harvard LabXchange, and Deserts of the World (download CSV).

Mechanism 1: Dry Quartz Sand Holds Only One-Fifth the Thermal Energy of Water (830 vs. 4,184 J/kg·K)

People often assume that because desert sand feels scorching to bare feet at 2:00 PM, the desert floor has stockpiled a huge reservoir of heat for the night. In reality, the exact opposite is true:

  • The 5-to-1 Specific Heat Ratio: Liquid water has one of the highest specific heat capacities of any common substance on Earth: 4,184 Joules per kilogram per Kelvin (J/kg·K). Dry quartz sand (SiO2) and desert rock have a specific heat capacity of roughly 800 to 830 J/kg·K—meaning it takes 5 times less energy to raise 1 kilogram of dry sand by 1°C than 1 kilogram of water, and when cooling begins at sunset, that same kilogram of sand has 80% less stored thermal energy to release before its temperature plummets.
  • Shallow 8-Centimeter Thermal Penetration: In an ocean or lake, solar radiation penetrates tens of meters downward and wind-driven turbulence mixes heat through a deep water column. In dry desert sand, air pockets trapped between loose quartz grains act as a thermal insulator below the surface. Solar energy cannot conduct deeply into the earth; instead, all incoming solar radiation is concentrated in a razor-thin 5 to 10 cm (2 to 4 inch) surface skin. Dig your hand six inches beneath scorching desert sand at noon and the subsurface grains feel cool; once the sun sets, that thin 8-centimeter crust exhausts its heat rapidly.

"Dry sand gets scorching hot during the day for the exact same reason it freezes at night: with a specific heat capacity of just 830 J/kg·K and zero downward mixing, all solar heating is trapped in the top few centimeters of dust and rock."

Mechanism 2: Unblocked Radiative Cooling Through the 8–12 µm Atmospheric Window

As Harvard LabXchange and radiative transfer physics emphasize, sand's low heat capacity is only half the equation—the decisive factor is what happens to the heat radiated upward after sunset:

  1. Water Vapor Is Earth's Primary Nighttime Blanket: By Planck's law and the Stefan-Boltzmann law (E = εσT⁴), the warm ground continuously emits thermal longwave infrared radiation peaking at wavelengths around 8 to 12 micrometers (µm). In a humid tropical forest (85% RH) or maritime city, abundant atmospheric water vapor (H2O gas) and low clouds absorb outgoing longwave infrared and re-radiate counter-radiation (downwelling longwave flux) back toward the ground, locking nighttime temperatures within 2.5°C to 8.5°C of the daytime high.
  2. The Clear-Sky Desert Escape Hatch: In subtropical and rain-shadow deserts where relative humidity drops to 10% to 15% and clouds are absent, the atmospheric infrared window (8–12 µm) stands wide open. Thermal infrared emitted by the hot sand shoots unimpeded into the 3 Kelvin (-270°C) heat sink of outer space, dropping air temperatures by 21.5°C (38.7°F) in the Sahara and Mojave, and by 25.5°C (45.9°F) in high-altitude deserts like the Atacama (>2,400 m).
Climate Regime / Biome Mean RH (%) Surface Specific Heat Daytime High Nighttime Low Diurnal Swing (DTR) Dominant Nighttime Heat-Transfer Process
Equatorial Open Ocean 82% 4,184 J/kg·K 29.0°C (84.2°F) 26.5°C (79.7°F) 2.5°C (4.5°F) 5x heat capacity + deep mixing + humid IR blanket
Humid Tropical Forest 85% ~3,200 J/kg·K 31.5°C (88.7°F) 24.5°C (76.1°F) 7.0°C (12.6°F) Dense column water vapor & clouds trap longwave IR
Maritime Coast (Seattle) 73% ~2,100 J/kg·K 18.5°C (65.3°F) 10.0°C (50.0°F) 8.5°C (15.3°F) Onshore marine layer moderates day/night extremes
Semi-Arid High Plains 42% ~1,250 J/kg·K 24.0°C (75.2°F) 8.5°C (47.3°F) 15.5°C (27.9°F) Lower humidity & elevation widen radiative loss
Sahara & Mojave Deserts 14% 830 J/kg·K 38.0°C (100.4°F) 16.5°C (61.7°F) 21.5°C (38.7°F) Shallow 8-cm sand crust radiates IR straight to space
High-Altitude Atacama 10% 800 J/kg·K 22.0°C (71.6°F) -3.5°C (25.7°F) 25.5°C (45.9°F) Thin air + bone-dry sky drives daily freeze-thaw

How to Check Daily Temperature Swings Before Packing for a Trip

Looking only at a destination's average daily high temperature hides whether you'll need a heavy down jacket after sunset: a 25°C (77°F) afternoon in Honolulu cools to a balmy 21°C (70°F) night, whereas a 25°C (77°F) spring afternoon in Joshua Tree or Calama can drop to 2°C (35°F) before sunrise. Compare daily high-low temperature swings and climate normals in Eranorms across global weather stations before you pack.

005 / 53

Why Does Water Boil at a Lower Temperature at High Altitude, and How Much Does Boiling Point Drop by Elevation?

In a national science-literacy survey conducted by the Pew Research Center, only 34% of American adults correctly knew that water boils at a lower temperature in high-altitude Denver than in sea-level Los Angeles (while 39% thought it boiled at the exact same temperature and 26% thought it boiled at a higher temperature because it takes longer to cook pasta in the mountains).

Why does a vigorous, rolling boil in Denver (1,609 m / 5,280 ft) reach only 94.7°C (202.5°F), why does water in La Paz, Bolivia (3,640 m / 11,942 ft) boil at 87.9°C (190.2°F), and why does a pot of boiling water on the summit of Mount Everest (8,849 m / 29,032 ft) top out at a lukewarm 70.5°C (158.9°F)? As explained by physicist Allan Harvey of the NIST Thermophysical Properties Division, boiling is not a fixed property of water alone—it is a mechanical tug-of-war between the liquid's internal saturation vapor pressure and the weight of the overlying atmosphere. To explore how station elevation, barometric pressure, and daily temperature normals interact across North American weather stations, you can Compare daily station temperature anomalies in Eranorms.

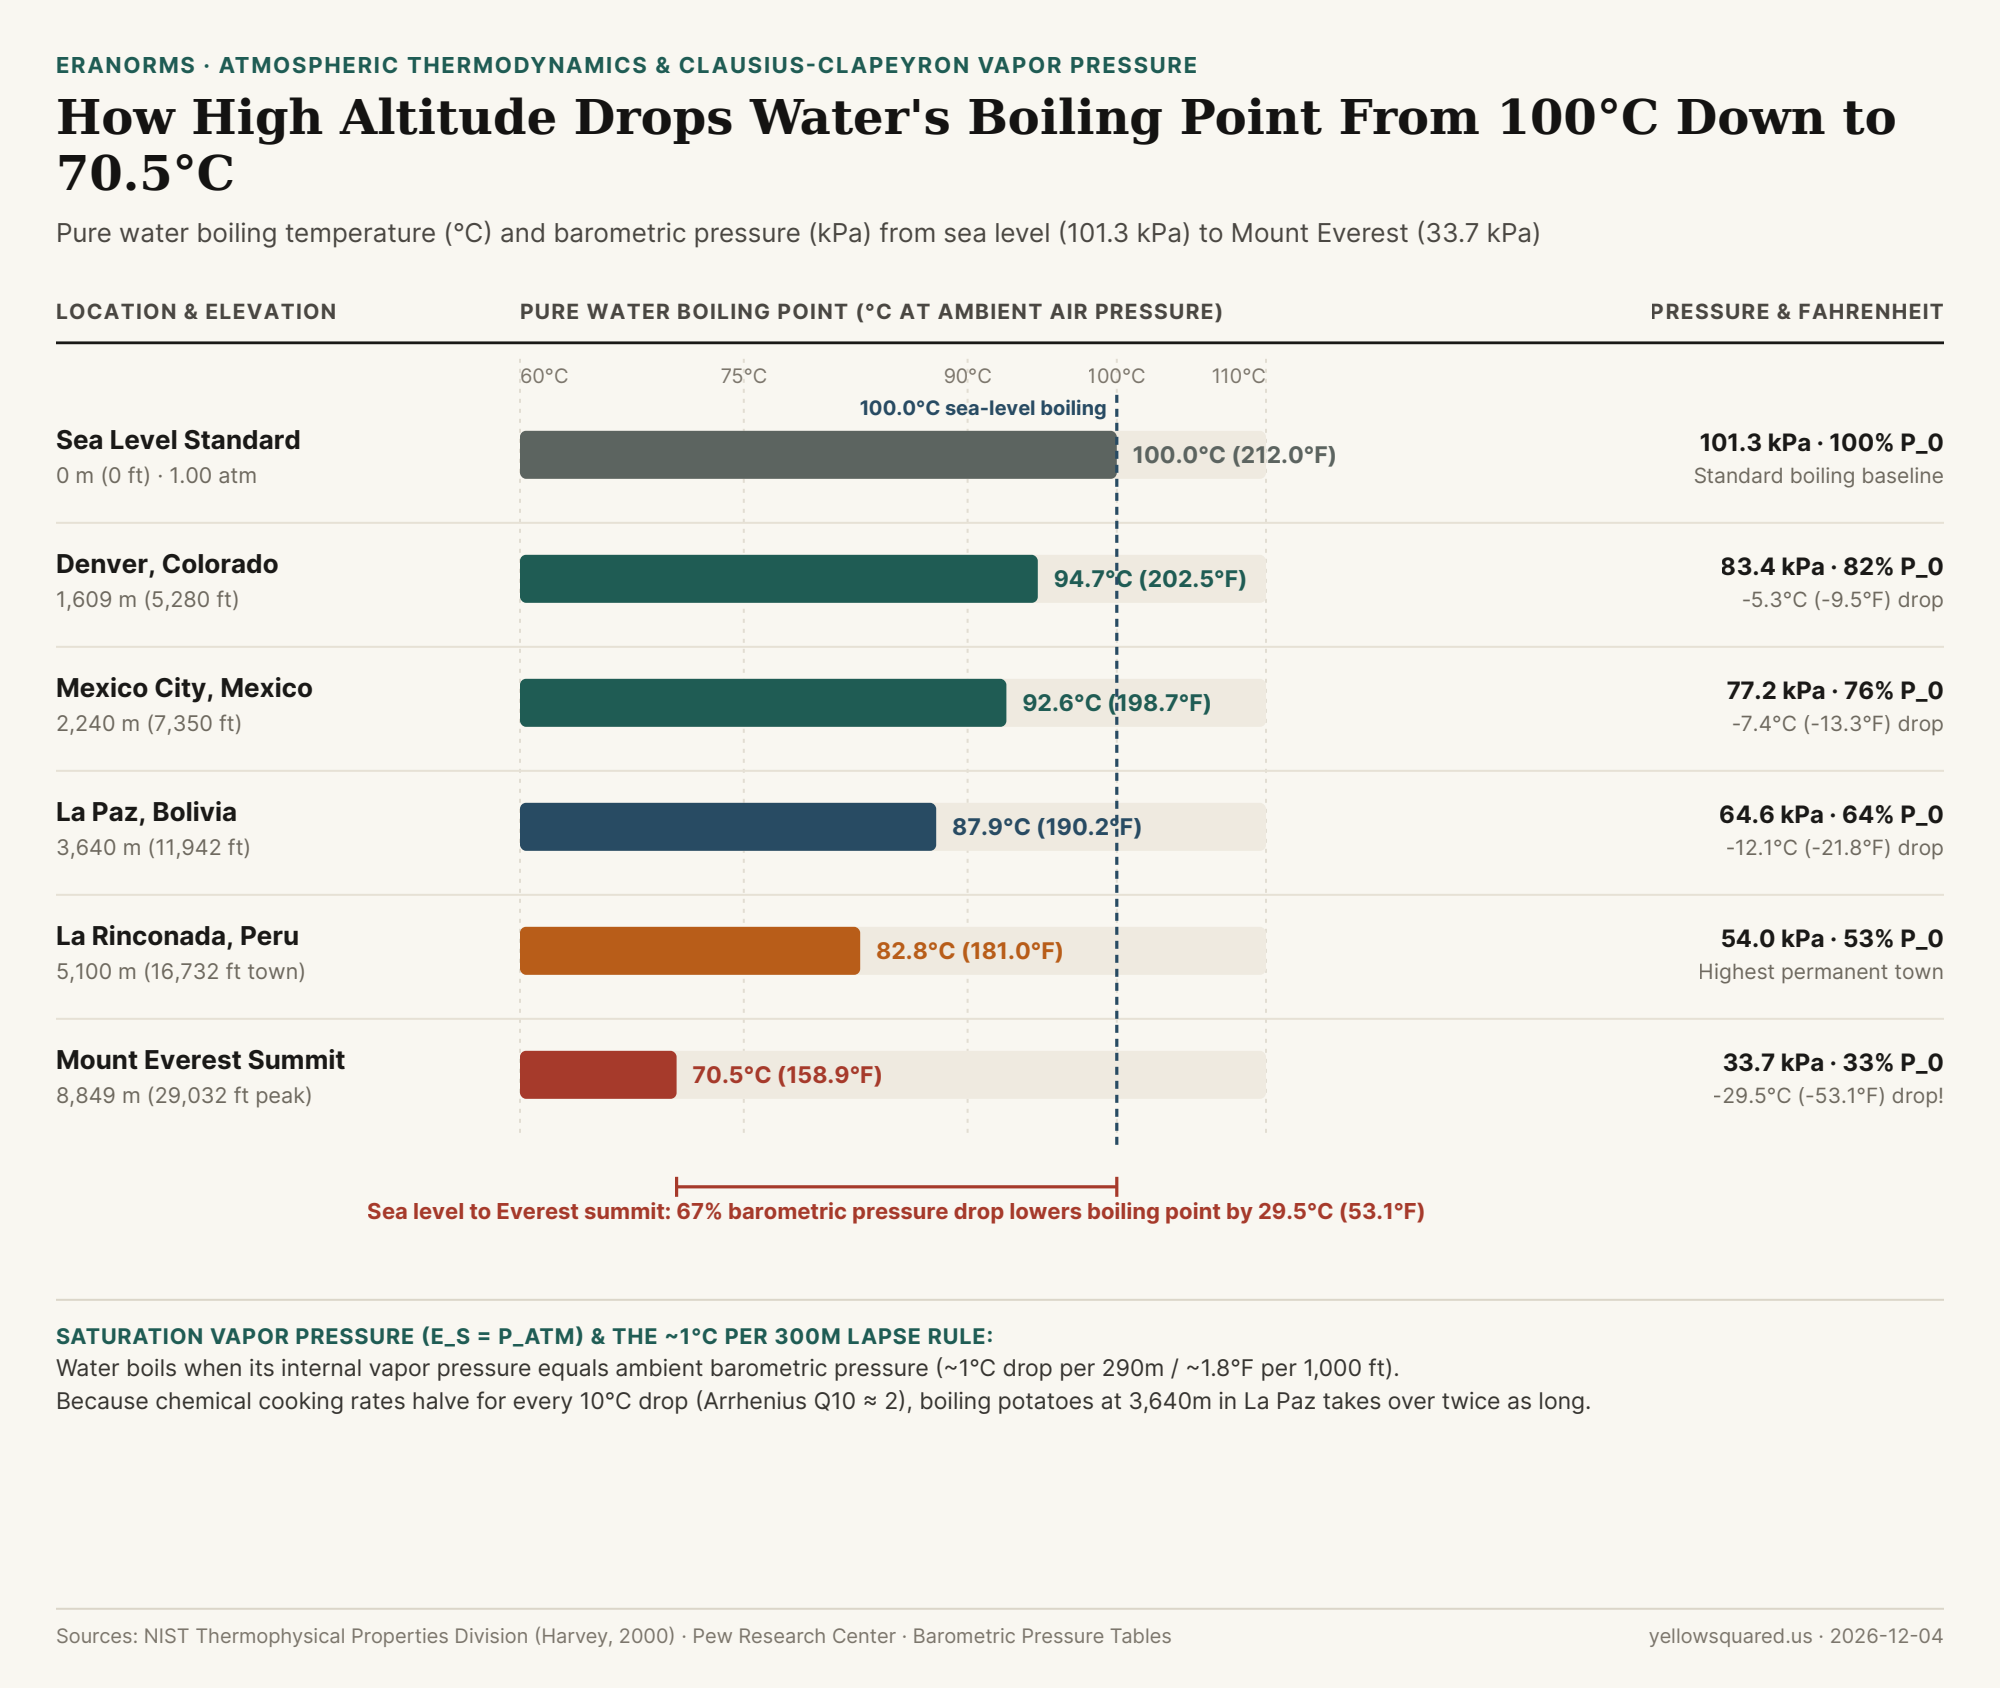
Horizontal bar chart comparing pure water boiling point in degrees Celsius and ambient barometric pressure in kilopascals across Sea Level, Denver, Mexico City, La Paz, La Rinconada, and Mount Everest.
Figure 1: Pure water boiling point (°C and °F) and ambient atmospheric pressure (kPa) across six elevation benchmarks from sea level (0 m) to Mount Everest (8,849 m). Source: NIST Thermophysical Properties Division, Barometric Boiling Point Tables, and Pew Research Center.

The Clausius–Clapeyron Equation: When Vapor Pressure Equals Barometric Pressure

Inside a pot of liquid water, molecules are constantly jostling and colliding. Even at room temperature, a small fraction of surface molecules gain enough kinetic energy to break their hydrogen bonds (latent heat of vaporization L_v ≈ 2,260 kJ/kg) and escape into the air as water vapor—creating an upward pressure known as saturation vapor pressure (e_s(T)). However, bubbles of pure steam cannot form inside the bulk liquid as long as the surrounding atmospheric pressure (P_atm) crushes nascent vapor pockets flat.

A rolling boil begins at the exact temperature where internal saturation vapor pressure equals ambient barometric pressure:

e_s(T_boil) = P_atm

At standard sea level, the column of air above your pot exerts 101.325 kilopascals (1.00 atm = 1,013.25 hPa = 14.696 psi) of downward pressure, and water must be heated to 100.0°C (212.0°F) before its vapor pressure reaches 101.325 kPa. As you climb a mountain, the hydrostatic barometric formula dictates that air pressure drops exponentially (falling by ~50% every 5,500 meters). By the Clausius–Clapeyron relation, lower ambient pressure means water molecules need far less thermal energy to push back the atmosphere—lowering the boiling point by approximately 1.0°C for every 290 to 300 meters of elevation gain (roughly 1.8°F to 1.9°F per 1,000 feet), as tabulated in standard elevation-pressure boiling tables.

"Turning up the stove flame under a boiling pot in Denver or La Paz will never make the water hotter: once water reaches its local boiling point (94.7°C in Denver or 87.9°C in La Paz), every extra watt of heat goes into converting liquid into escaping steam at that exact ceiling temperature."

Why High Altitude Makes Boiling Slower—Even Though Water Boils Faster!

Here lies the culinary paradox that confuses so many people in the Pew survey: at high altitude, a pot of cold tap water reaches a boil faster (because it only has to heat to 94.7°C instead of 100.0°C), yet cooking food in that boiling water takes much longer!

Why? Because a boiling pot is a thermostat locked at T_boil. By the Arrhenius equation (Q10 ≈ 2), the chemical reaction rates of protein denaturation, collagen hydrolysis, and starch gelatinization roughly cut in half for every 10°C (18°F) drop in temperature. Simmering pasta or potatoes in La Paz at 87.9°C (-12.1°C below sea level) runs at less than half the thermal reaction speed of a 100°C sea-level pot. And on the summit of Mount Everest (8,849 m, where ambient pressure is 33.7 kPa—one-third of sea level—and water boils at 70.5°C / 158.9°F), boiling water cannot even coagulate the ovalbumin protein in an egg white (which requires ~80°C) or gelatinize potato starch!

Location Benchmark Elevation (m / ft) Barometric Pressure % of Sea-Level Air Boiling Point (°C) Boiling Point (°F)
Death Valley, CA (Badwater) -86 m (-282 ft) 102.3 kPa 101.0% 100.3°C 212.5°F
Sea Level Standard Baseline 0 m (0 ft) 101.3 kPa (1 atm) 100.0% 100.0°C 212.0°F
Denver, CO ("Mile High City") 1,609 m (5,280 ft) 83.4 kPa 82.3% 94.7°C 202.5°F
Mexico City, Mexico 2,240 m (7,350 ft) 77.2 kPa 76.2% 92.6°C 198.7°F
La Paz, Bolivia 3,640 m (11,942 ft) 64.6 kPa 63.8% 87.9°C 190.2°F
La Rinconada, Peru 5,100 m (16,732 ft) 54.0 kPa 53.3% 82.8°C 181.0°F
Mount Everest Summit 8,849 m (29,032 ft) 33.7 kPa (0.33 atm) 33.3% 70.5°C 158.9°F

How a Pressure Cooker Restores Sea-Level Physics in the Mountains

The only way to raise the temperature of boiling water at high altitude is to trap the escaping steam inside a sealed vessel. A standard household pressure cooker adds 15 psi (103.4 kPa) of gauge pressure on top of the local atmosphere—bringing total internal pressure in Denver (83.4 + 103.4 = 186.8 kPa) well above sea-level atmospheric pressure and raising the boiling point inside the pot to 118°C (244°F) (or 121°C / 250°F at sea level). To explore station elevation, atmospheric pressure regimes, and historical climate baselines across high-altitude and coastal cities, Compare daily station temperature anomalies in Eranorms.

006 / 53

What Is the Urban Heat Island Effect, and Why Are Cities Up to 5 Degrees Warmer at Night Than Rural Areas?

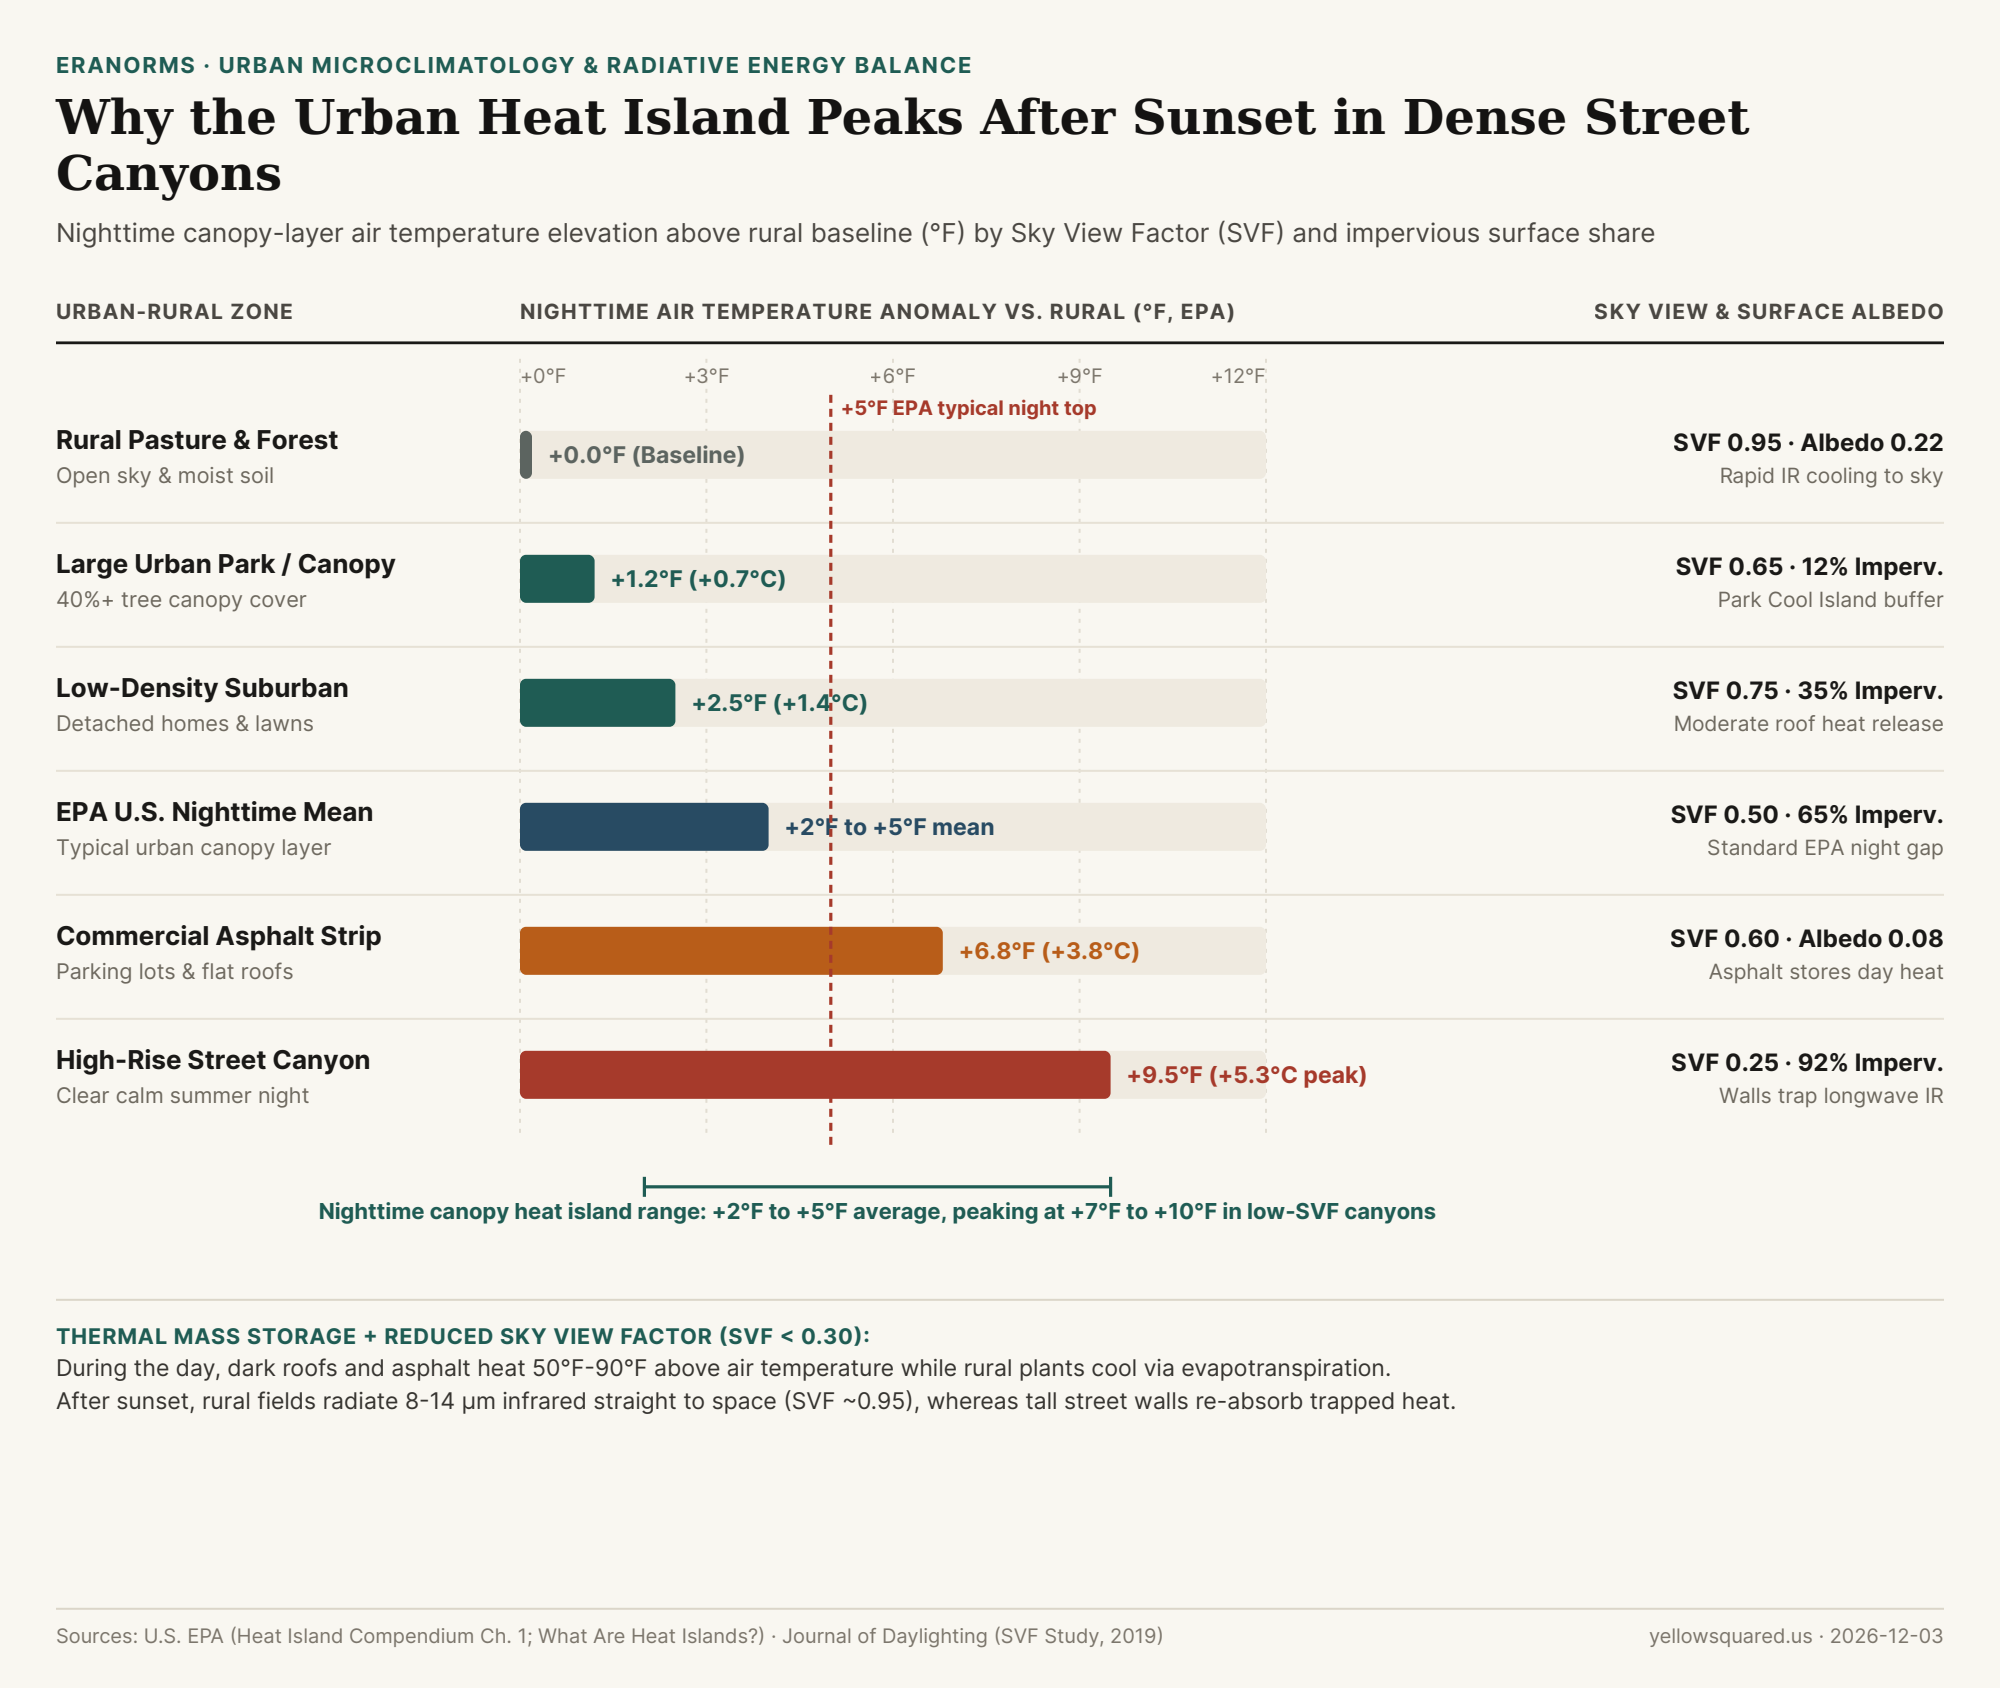
Most people assume the urban heat island (UHI) effect peaks at 2:00 PM on a blazing summer afternoon, when dark parking lots shimmer in the sun. While exposed asphalt and dark roofs do reach surface temperatures 50°F to 90°F (27°C to 50°C) hotter than the air at midday, meteorologists distinguish between the surface heat island and the canopy-layer atmospheric heat island—the air temperature measured two meters above the ground where people actually walk and sleep. According to the U.S. Environmental Protection Agency (EPA), U.S. cities average 1°F to 7°F (0.6°C to 3.9°C) warmer than outlying rural areas during the day, but maintain a persistent 2°F to 5°F (1.1°C to 2.8°C) nighttime elevation—with calm, clear summer nights regularly producing canopy air anomalies of 7°F to 10°F+ (4°C to 5.5°C+) in dense downtown cores.

In fact, as documented in Chapter 1 of the EPA Compendium of Urban Heat Island Strategies, the atmospheric temperature gap between a city center and its surrounding countryside typically reaches its daily maximum three to five hours after sunset. To see how urban station siting and overnight minimum temperatures (Tmin) diverge from historical baselines at your local airport, you can Compare daily station temperature anomalies in Eranorms across decades of NOAA ASOS observations.

Horizontal bar chart comparing nighttime air temperature anomaly in degrees Fahrenheit, Sky View Factor, and impervious surface percentage across six rural-to-urban zones.
Figure 1: Nighttime canopy-layer air temperature elevation (°F above rural baseline), Sky View Factor (SVF), and impervious surface coverage across six land-cover zones. Source: U.S. EPA (What Are Heat Islands?), U.S. EPA UHI Compendium Ch. 1, and Journal of Daylighting (2019).

The Surface Energy Balance: Why Cities Refuse to Cool Down After Sunset

Every landscape obeys the surface energy balance equation: net incoming radiation (Q*) plus anthropogenic waste heat (Q_F) must equal sensible convective heating of the air (Q_H), latent evaporative cooling (Q_E), and conductive heat storage into the ground (ΔQ_S). Cities alter all four terms simultaneously:

  1. Low Albedo & Massive Conductive Thermal Storage (ΔQ_S): Fresh asphalt has a solar reflectance (albedo) of just 0.05 (absorbing 95% of incoming sunlight), while aged asphalt and dark roofing membranes sit between 0.08 and 0.15. Because concrete, brick, and stone have high volumetric heat capacity and thermal conductivity, urban infrastructure acts like a giant masonry battery—soaking up megajoules of solar energy all afternoon and releasing it upward as sensible heat (Q_H) throughout the night.
  2. Shutting Off Evapotranspirative Air Conditioning (Q_E → Q_H): In a rural forest or irrigated pasture, trees and soil moisture use incoming solar energy to evaporate water (2,450 joules per gram of water vaporized), keeping leaf surfaces cool via latent heat flux (Q_E). When impervious roofs and streets cover 65% to 92% of a downtown watershed, rainfall is shunted into storm drains, forcing nearly all absorbed solar energy into direct air heating (Q_H).
  3. Sky View Factor (SVF) Trapping inside Urban Street Canyons: As quantified in microclimate studies of Sky View Factor in high-rise urban street canyons, radiative cooling at night depends on how much of the cold upper hemisphere (0.0 to 1.0) a surface can "see." An open rural field has SVF ≈ 0.95, allowing ground surfaces to radiate longwave thermal infrared (8–14 µm) straight through the atmospheric window into space. In a narrow downtown canyon flanked by high-rise buildings (SVF < 0.30), over 70% of the upward hemisphere is blocked by warm neighboring walls that intercept and re-radiate infrared energy back onto the street.

"A rural meadow with a 0.95 Sky View Factor radiates its daytime heat straight into the cold night sky after sunset; a downtown street canyon with a 0.25 Sky View Factor bounces 8-to-14-micrometer infrared radiation back and forth between facing concrete walls until dawn."

Comparing Nighttime Warming Across Six Rural-to-Urban Microclimates

Because longwave radiative cooling is strongest when skies are cloud-free and winds are calm (< 5 mph, preventing turbulent mixing of the nocturnal boundary layer), the intra-urban temperature gradient across a single metropolitan area often spans 8°F to 10°F on summer nights:

Land-Cover Microclimate Sky View Factor (SVF) Impervious Share Surface Albedo Daytime Air Delta Nighttime Air Delta
Rural Pasture & Forest Baseline 0.95 ~2% 0.20 – 0.25 +0.0°F (Baseline) +0.0°F (Baseline)
Large Urban Park (40%+ Canopy) 0.65 ~12% 0.18 +0.5°F +1.2°F (Park Cool Island)
Low-Density Suburban Neighborhood 0.75 ~35% 0.16 +1.8°F +2.5°F
EPA U.S. City Average (Canopy Layer) 0.50 ~65% 0.12 +1°F to +7°F +2°F to +5°F
Commercial Asphalt & Flat-Roof Strip 0.60 ~85% 0.08 +6.5°F +6.8°F
High-Rise Street Canyon (Calm Night) 0.25 (<0.30) ~92% 0.10 +5.2°F (Shaded) +9.5°F (Peak IR trap)

Why High Overnight Low Temperatures (Tmin) Drive Heat-Wave Mortality

Notice a subtle paradox in the table above: during the middle of the day, a deep high-rise street canyon (+5.2°F) can actually feel slightly cooler than an unshaded suburban shopping-mall parking lot (+6.5°F) because tall towers cast deep shadows on the sidewalk. At night, however, that same street canyon becomes the hottest zone in the metropolitan region (+9.5°F) because its low Sky View Factor (0.25) blocks radiative heat escape while air-conditioning condensers pump anthropogenic waste heat (Q_F) into the stagnant canyon air. Public health epidemiologists emphasize that elevated overnight minimums (Tmin > 75°F / 24°C) prevent human cardiovascular recovery during multi-day heat waves. To track how daily minimum temperatures (Tmin) and maximum temperatures (Tmax) behave against 30-year climate normals at your nearest station, Compare daily station temperature anomalies in Eranorms.

007 / 53

What Is a Chinook Wind, and How Did Loma, Montana Warm 103 Degrees in 24 Hours?

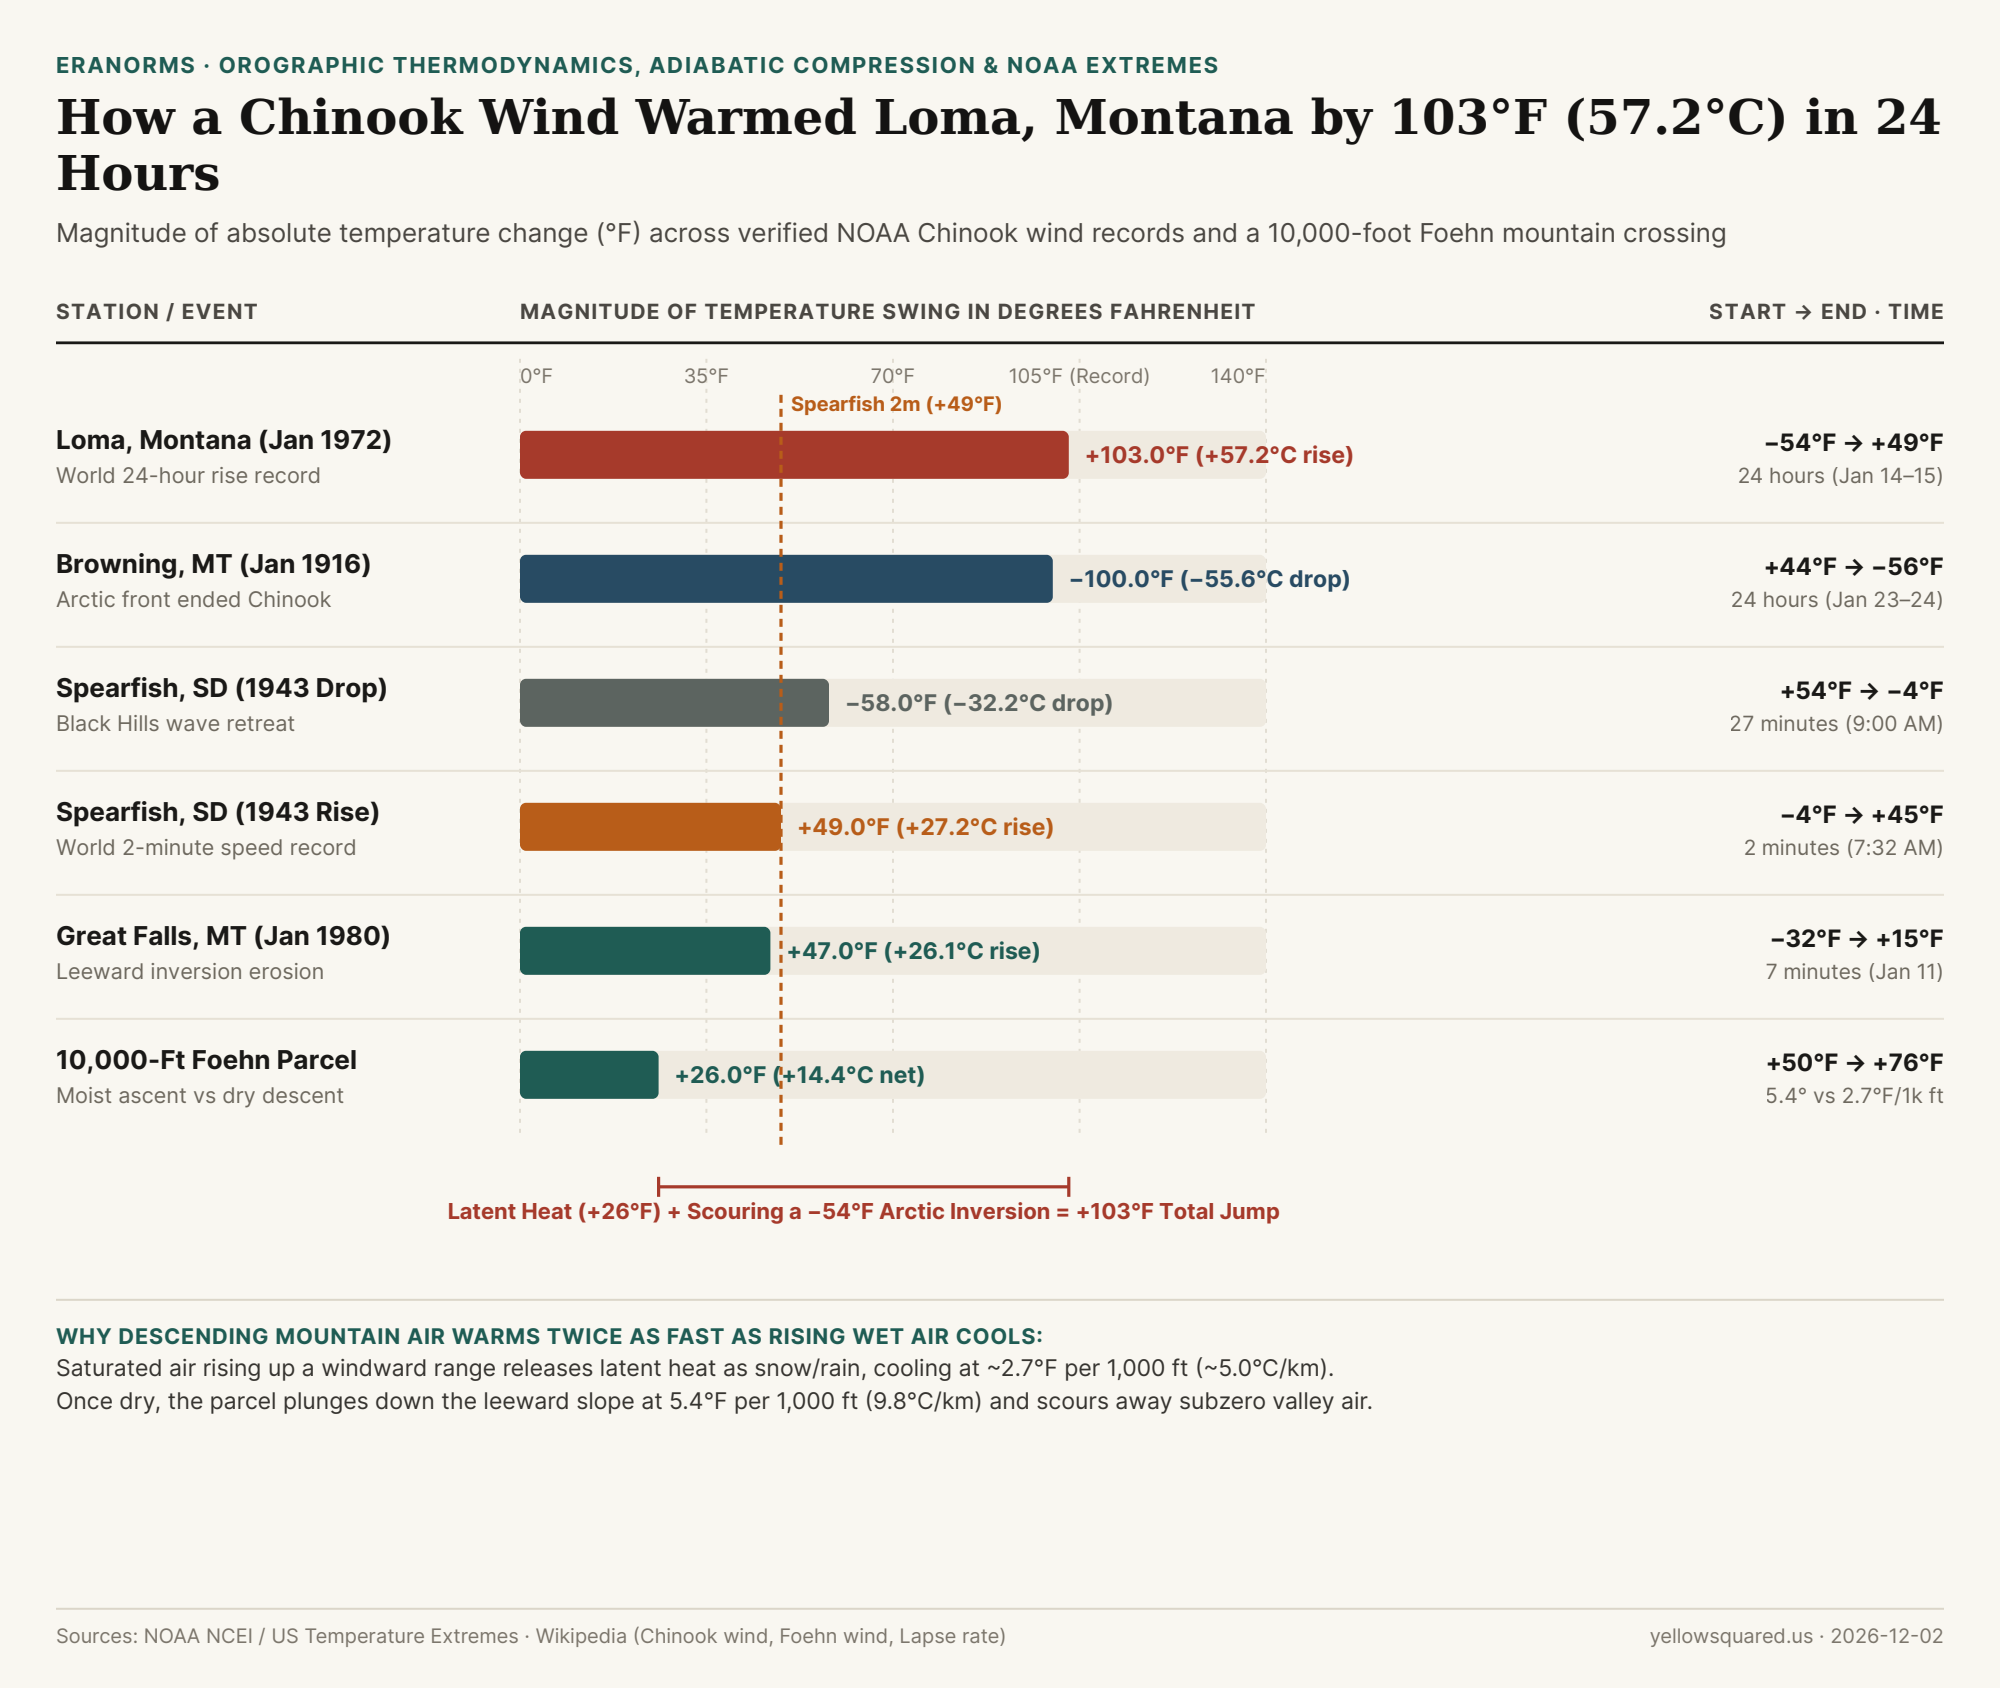
Between 9:00 AM on January 14 and 8:00 AM on January 15, 1972, the official weather station in Loma, Montana recorded the largest 24-hour temperature change ever measured on Earth: the air temperature rocketed by 103°F (57.2°C), climbing from a bone-chilling −54°F (−47.8°C) to +49°F (+9.4°C) (Chinook wind - Wikipedia; United States temperature extremes - Wikipedia). Even faster, on the morning of January 22, 1943, in Spearfish, South Dakota, a roaring westerly gust raised the temperature by 49°F (27.2°C) in just two minutes—jumping from −4°F (−20.0°C) at 7:30 AM to +45°F (+7.2°C) at 7:32 AM and cracking frosted plate-glass windows across town (Chinook wind - Wikipedia).

Both meteorological extremes were driven by a Chinook wind—the North American name for a warm, dry downslope Foehn wind descending the leeward side of a mountain barrier (Foehn wind - Wikipedia). To see how sudden winter downslope warming spikes compare against 30-year seasonal station baselines, Compare live station extremes against historical climate normals in Eranorms.

Chart comparing temperature swings in degrees Fahrenheit across Loma 1972 (+103°F), Browning 1916 (-100°F), Spearfish 1943 (+49°F in 2m and -58°F in 27m), Great Falls 1980 (+47°F), and a 10,000-foot Foehn parcel (+26°F)
Figure 1: Verified NOAA Chinook temperature swings (°F) compared against single-pass latent and adiabatic heating across a 10,000-foot mountain barrier. Data: chinook-foehn-wind-adiabatic-lapse-rates-and-historical-temperature-swings.csv (Chinook wind - Wikipedia; Lapse rate - Wikipedia).

Mechanism 1: Moist vs. Dry Adiabatic Lapse Rates (+26°F Across 10,000 Feet)

Why does air arrive at the bottom of the eastern Rocky Mountains dramatically warmer than when it started at the exact same elevation on the western windward slope? The classical thermodynamic mechanism comes from the asymmetry between the moist adiabatic lapse rate (MALR) and the dry adiabatic lapse rate (DALR) (Lapse rate - Wikipedia; Foehn wind - Wikipedia):

  • Windward Ascent at the Moist Adiabatic Rate (~2.7°F / 1,000 ft or 5.0°C / km): Once a rising maritime air parcel cools to its dew point (the lifting condensation level), water vapor condenses into clouds, rain, and snow. Condensing 1 gram of water vapor releases 2,500 joules of latent heat into the air parcel, slowing its cooling rate to roughly 2.7°F per 1,000 feet (~5.0°C/km) (Lapse rate - Wikipedia).
  • Leeward Descent at the Dry Adiabatic Rate (5.4°F / 1,000 ft or 9.8°C / km): After precipitating its moisture onto the windward peaks, the now-dry air parcel plunges down the leeward eastern slope. Rising atmospheric pressure compresses the parcel, warming it at the full dry adiabatic rate of 5.4°F per 1,000 feet (9.8°C/km)—nearly twice the rate at which it cooled on the way up (Lapse rate - Wikipedia).
  • Net Parcel Gain Across a 10,000-Foot (3,000 m) Barrier: An air parcel starting at +50°F (+10.0°C) that rises 10,000 feet saturated (−27°F to +23°F at the crest) and descends 10,000 feet dry (+54°F of compressional warming) reaches the leeward plains at +76°F (+24.4°C)—a net thermodynamic gain of +26°F (+14.4°C).

"Latent heat adds 20°F to 30°F as air crosses a mountain range, but a 103°F Chinook surge happens when that downslope jet scours away a shallow −50°F Arctic air mass pooled on the plains."

Mechanism 2: Isentropic Drawdown & Arctic Inversion Scouring

If latent heat release over a mountain range adds 20°F to 30°F, how did Loma, Montana warm by 103°F? Modern mesoscale meteorology shows that extreme winter Chinooks combine mechanical isentropic drawdown with Arctic air-mass displacement (Foehn wind - Wikipedia; Chinook wind - Wikipedia):

  1. Shallow Subzero Continental Polar Pools: Before a winter Chinook strikes the High Plains of Montana, Alberta, or South Dakota, a dense, shallow layer of radiatively cooled Arctic air (often only 300 to 600 meters deep) sits trapped against the eastern foothills at −30°F to −54°F.
  2. Mountain Wave Scouring & Hydraulic Jumps: When strong westerly winds blow across the Rockies or Black Hills, high-potential-temperature air from near crest level is forced violently down the leeward slope. As this turbulent downslope jet flushes the shallow Arctic pool eastward, surface thermometers transition in minutes from a radiative subzero inversion into the adiabatically compressed Pacific air mass (Chinook wind - Wikipedia).
  3. Sloshing Leeward Boundaries (Spearfish 1943 & Browning 1916): Because the boundary between the warm Chinook jet and the dense Arctic air mass is razor-sharp, when the mountain wave weakens or retreats, the subzero air sloshes back just as fast. In Spearfish on January 22, 1943, after warming +49°F in 2 minutes at 7:32 AM and peaking at +54°F, the Chinook retreated at 9:00 AM and the temperature plunged −58°F (from +54°F back to −4°F) in 27 minutes (Chinook wind - Wikipedia).
Station / Thermodynamic Event Date or Step Start Temp End Temp Net Swing Duration & Mechanism
1. Loma, Montana (World Record) Jan 14–15, 1972 −54.0°F (−47.8°C) +49.0°F (+9.4°C) +103.0°F (+57.2°C) 24 hours · World 24h record
2. Browning, Montana (Drop) Jan 23–24, 1916 +44.0°F (+6.7°C) −56.0°F (−48.9°C) −100.0°F (−55.6°C) 24 hours · Arctic front return
3. Spearfish, SD (Morning Drop) Jan 22, 1943 +54.0°F (+12.2°C) −4.0°F (−20.0°C) −58.0°F (−32.2°C) 27 minutes · Wave retreat
4. Spearfish, SD (2-Min Rise) Jan 22, 1943 −4.0°F (−20.0°C) +45.0°F (+7.2°C) +49.0°F (+27.2°C) 2 minutes · Fastest rise
5. Great Falls, Montana Jan 11, 1980 −32.0°F (−35.6°C) +15.0°F (−9.4°C) +47.0°F (+26.1°C) 7 minutes · Inversion eroded
6. 10,000-Ft Foehn Parcel 0 → 3,000m → 0m +50.0°F (+10.0°C) +76.0°F (+24.4°C) +26.0°F (+14.4°C) Moist (2.7°F) vs dry (5.4°F/1k ft)

Why Chinooks Are Called "Snow Eaters" Along the Front Range

Because adiabatically compressed Chinook air arrives at the base of the mountains with relative humidity often below 10% to 15% and wind gusts exceeding 50 to 80 mph, it simultaneously melts and sublimates a foot of snowpack in hours—earning the Indigenous and fur-trade moniker "Snow Eater" (Chinook wind - Wikipedia). Look up toward the crest during a Chinook and you will frequently spot the signature Chinook arch: a stationary band of altocumulus standing lenticular clouds riding the crest of the leeward atmospheric gravity wave while clear blue sky opens directly over the mountains. To track live temperature, dew point, and pressure swings against historical ASOS station records, Compare live station extremes against historical climate normals in Eranorms.

008 / 53

Why Do Double Rainbows Have a Dark Sky Band Between Them and Reverse Their Colors at 51 Degrees?

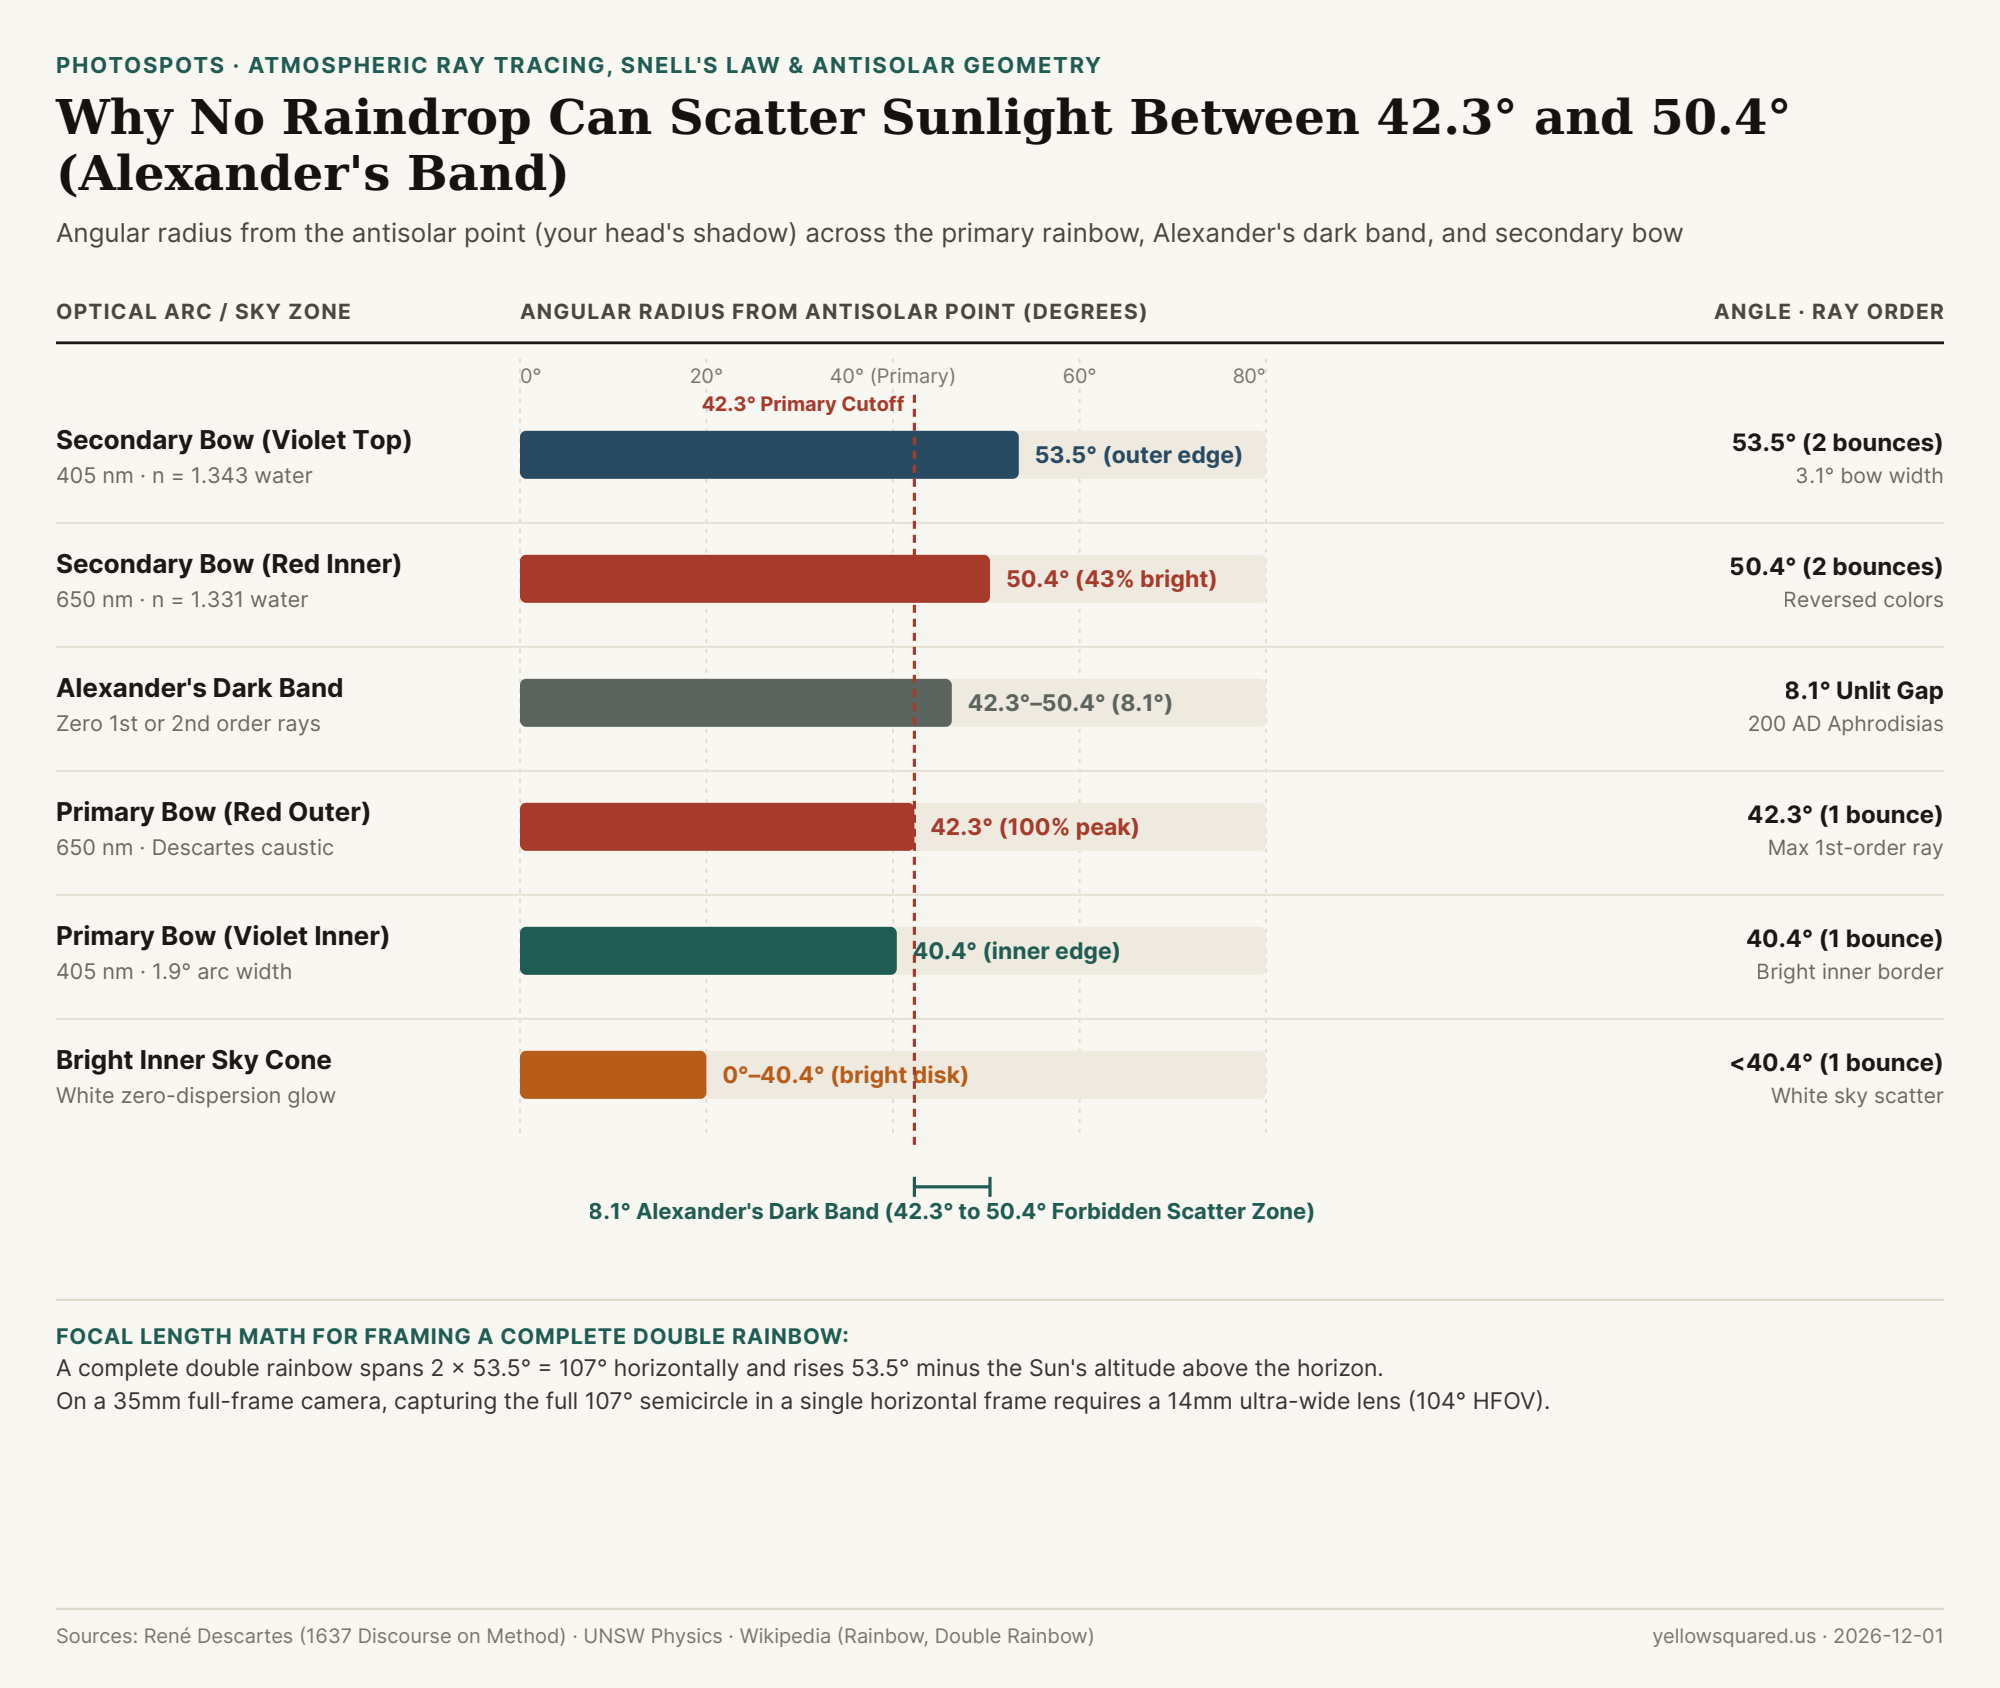
Look closely at any vivid double rainbow and you will notice three striking optical features: the sky inside the inner primary bow glows noticeably brighter than the rest of the storm clouds, the outer secondary bow has its color order completely upside down (red on the inside, violet on the outside), and the 8.1-degree strip of sky sandwiched between the two bows looks dramatically darker than the sky on either side (Rainbow - Wikipedia; Chromatic dispersion, rainbows and Alexander's dark band - UNSW Physics). That dark gap is Alexander's dark band, named after the Greek philosopher Alexander of Aphrodisias who first documented it in 200 AD (Rainbow - Wikipedia).

Knowing the exact angular geometry of the 42° primary bow and 51° secondary bow around the antisolar point lets you predict exactly when a storm clearing at golden hour will produce a towering double arc—and choose the right lens focal length when you Scout golden hour and blue hour angles in PhotoSpots.

Chart showing angular radius from the antisolar point for the bright inner sky cone, 40.4 to 42.3 degree primary rainbow, 8.1-degree Alexander's dark band, and 50.4 to 53.5 degree secondary rainbow
Figure 1: Angular radius from the antisolar point across the bright inner cone, primary bow (40.4°–42.3°), Alexander's dark band (42.3°–50.4°), and secondary bow (50.4°–53.5°). Data: double-rainbow-primary-42-deg-secondary-51-deg-and-alexanders-dark-band-optics.csv (Rainbow - Wikipedia; UNSW Physics).

Descartes' Minimum Deviation Caustic: Why the Primary Bow Stops at 42.3°

In 1637, René Descartes traced parallel rays of sunlight entering spherical raindrops at varying impact parameters and solved the geometry of the rainbow using Snell's law of refraction (Rainbow - Wikipedia). When a ray of sunlight enters a raindrop, reflects once off the back inner wall, and refracts back out toward the observer, its total angular deviation reaches a sharp mathematical minimum—the Descartes ray (caustic):

  • Red Light (650 nm, refractive index n = 1.331): Bends slightly less in water, reaching its maximum viewing angle from the antisolar point at 42.3° (a total ray deviation of 137.7°) (Rainbow - Wikipedia).
  • Violet Light (405 nm, refractive index n = 1.343): Bends more strongly in water, reaching its maximum viewing angle at 40.4° (a total ray deviation of 139.6°) (UNSW Physics).
  • Why the Sky Inside 40.4° Is Bright White: Raindrops do not scatter light only at 40.4°–42.3°; they scatter single-reflection rays at all angles from 0° up to 42.3°. Because every wavelength overlaps below 40.4°, the entire inner cone of sky inside the primary rainbow is flooded with bright, unseparated white light—while zero first-order rays can exit at any angle greater than 42.3° (UNSW Physics).

Why the Secondary Rainbow Reverses Its Colors at 50.4°–53.5°

A secondary rainbow forms when sunlight enters the bottom half of a spherical raindrop and undergoes two internal reflections before exiting toward your eye (Double Rainbow - Wikipedia). That second internal bounce changes the geometry in three measurable ways:

  1. Minimum Deviation Exceeds 180° (Color Inversion): Two internal reflections bend the ray by more than a straight line—230.4° for red light and 233.5° for violet light. Subtracting 180° gives a viewing angle of 50.4° for red (inner edge) and 53.5° for violet (outer edge), flipping the color sequence upside down (Rainbow - Wikipedia).
  2. 3.1° Width vs. 1.9° Primary Width: The additional reflection increases angular dispersion, stretching the secondary bow to 3.1° wide—roughly 1.6× wider than the 1.9° primary bow.
  3. 43% Relative Surface Brightness: Because part of the beam escapes out the back of the raindrop on the second bounce and the remaining light spreads across a wider 3.1° band, the secondary rainbow shines at roughly 43% of the surface brightness of the primary bow.

"Alexander's dark band (42.3° to 50.4°) is an 8.1-degree optical shadow in the sky: single-reflection rays can only scatter below 42.3°, and double-reflection rays can only scatter above 50.4°."

Optical Sky Zone / Arc Angle from Antisolar Point Internal Reflections Water Index (n) Color Order / Appearance Relative Sky Brightness
1. Inner Sky Cone 0.0° to 40.4° 1 reflection 1.331–1.343 Mixed white zero-order scatter 100% (Brightest sky cone)
2. Primary Bow (Violet Inner) 40.4° (139.6° dev) 1 reflection n = 1.343 (405 nm) Innermost violet band High caustic concentration
3. Primary Bow (Red Outer) 42.3° (137.7° dev) 1 reflection n = 1.331 (650 nm) Outermost red band (1.9° wide) 100% primary bow peak
4. Alexander's Dark Band 42.3° to 50.4° (8.1°) Zero 1st/2nd rays Forbidden zone Dark unlit sky gap between bows ~35% (Darkest sky band)
5. Secondary Bow (Red Inner) 50.4° (230.4° dev) 2 reflections n = 1.331 (650 nm) Innermost red band (reversed) 43% of primary bow
6. Secondary Bow (Violet Outer) 53.5° (233.5° dev) 2 reflections n = 1.343 (405 nm) Outermost violet band (3.1° wide) 43% of primary bow

Sun Altitude Rules & Lens Focal Length Math for Photographers

Because the center of every rainbow is the antisolar point—located at an angle −α below the horizon directly opposite the Sun's altitude +α—a primary rainbow disappears below flat ground whenever the Sun climbs higher than 42.3° above the horizon, while a secondary rainbow remains visible until the Sun exceeds 53.5° (Rainbow - Wikipedia). When the Sun sits right on the horizon at sunrise or sunset (α = 0°), a full double rainbow forms a towering 107-degree semicircle (2 × 53.5°). On a 35mm full-frame camera, a 24mm lens (73.7° horizontal field of view) can only capture one leg of the arch; framing the entire 84.6° primary semicircle requires at least a 16mm–18mm lens, and framing the full 107° double rainbow in a single horizontal shot requires a 14mm ultra-wide lens (104° horizontal / 114° diagonal FOV) or a multi-shot vertical panorama. To check exact solar altitude and antisolar azimuth vectors before a post-storm clearing, Scout golden hour and blue hour angles in PhotoSpots.