YellowSquared  /  Field notes

Notes from the workshop

19 posts, newest first. Choose an app to narrow the feed.

001 / 19

Why Do You Forget 70% of What You Study Within 24 Hours? (The Ebbinghaus Forgetting Curve & Spaced Repetition)

You spend an entire evening reading a textbook chapter or sitting through a dense technical workshop, feeling confident that you understand every concept—only to blank on two-thirds of the details by the next afternoon. That rapid mental wipeout is not a personal flaw; it is the classic Ebbinghaus Forgetting Curve, first quantified by German psychologist Hermann Ebbinghaus in 1885 (and successfully replicated in modern cognitive trials such as Murre & Dros in 2015).

As detailed in SuperMemo's analysis of Ebbinghaus's Chapter 7 experiments and cognitive memory reviews citing Cepeda et al. (2008), unreviewed rote information decays at its fastest rate in the first 60 minutes to 24 hours—losing roughly 70% of retention savings within a single day unless active retrieval interrupts the curve. Schedule spaced review blocks and study intervals in Timeli so your hardest material comes back right before it fades.
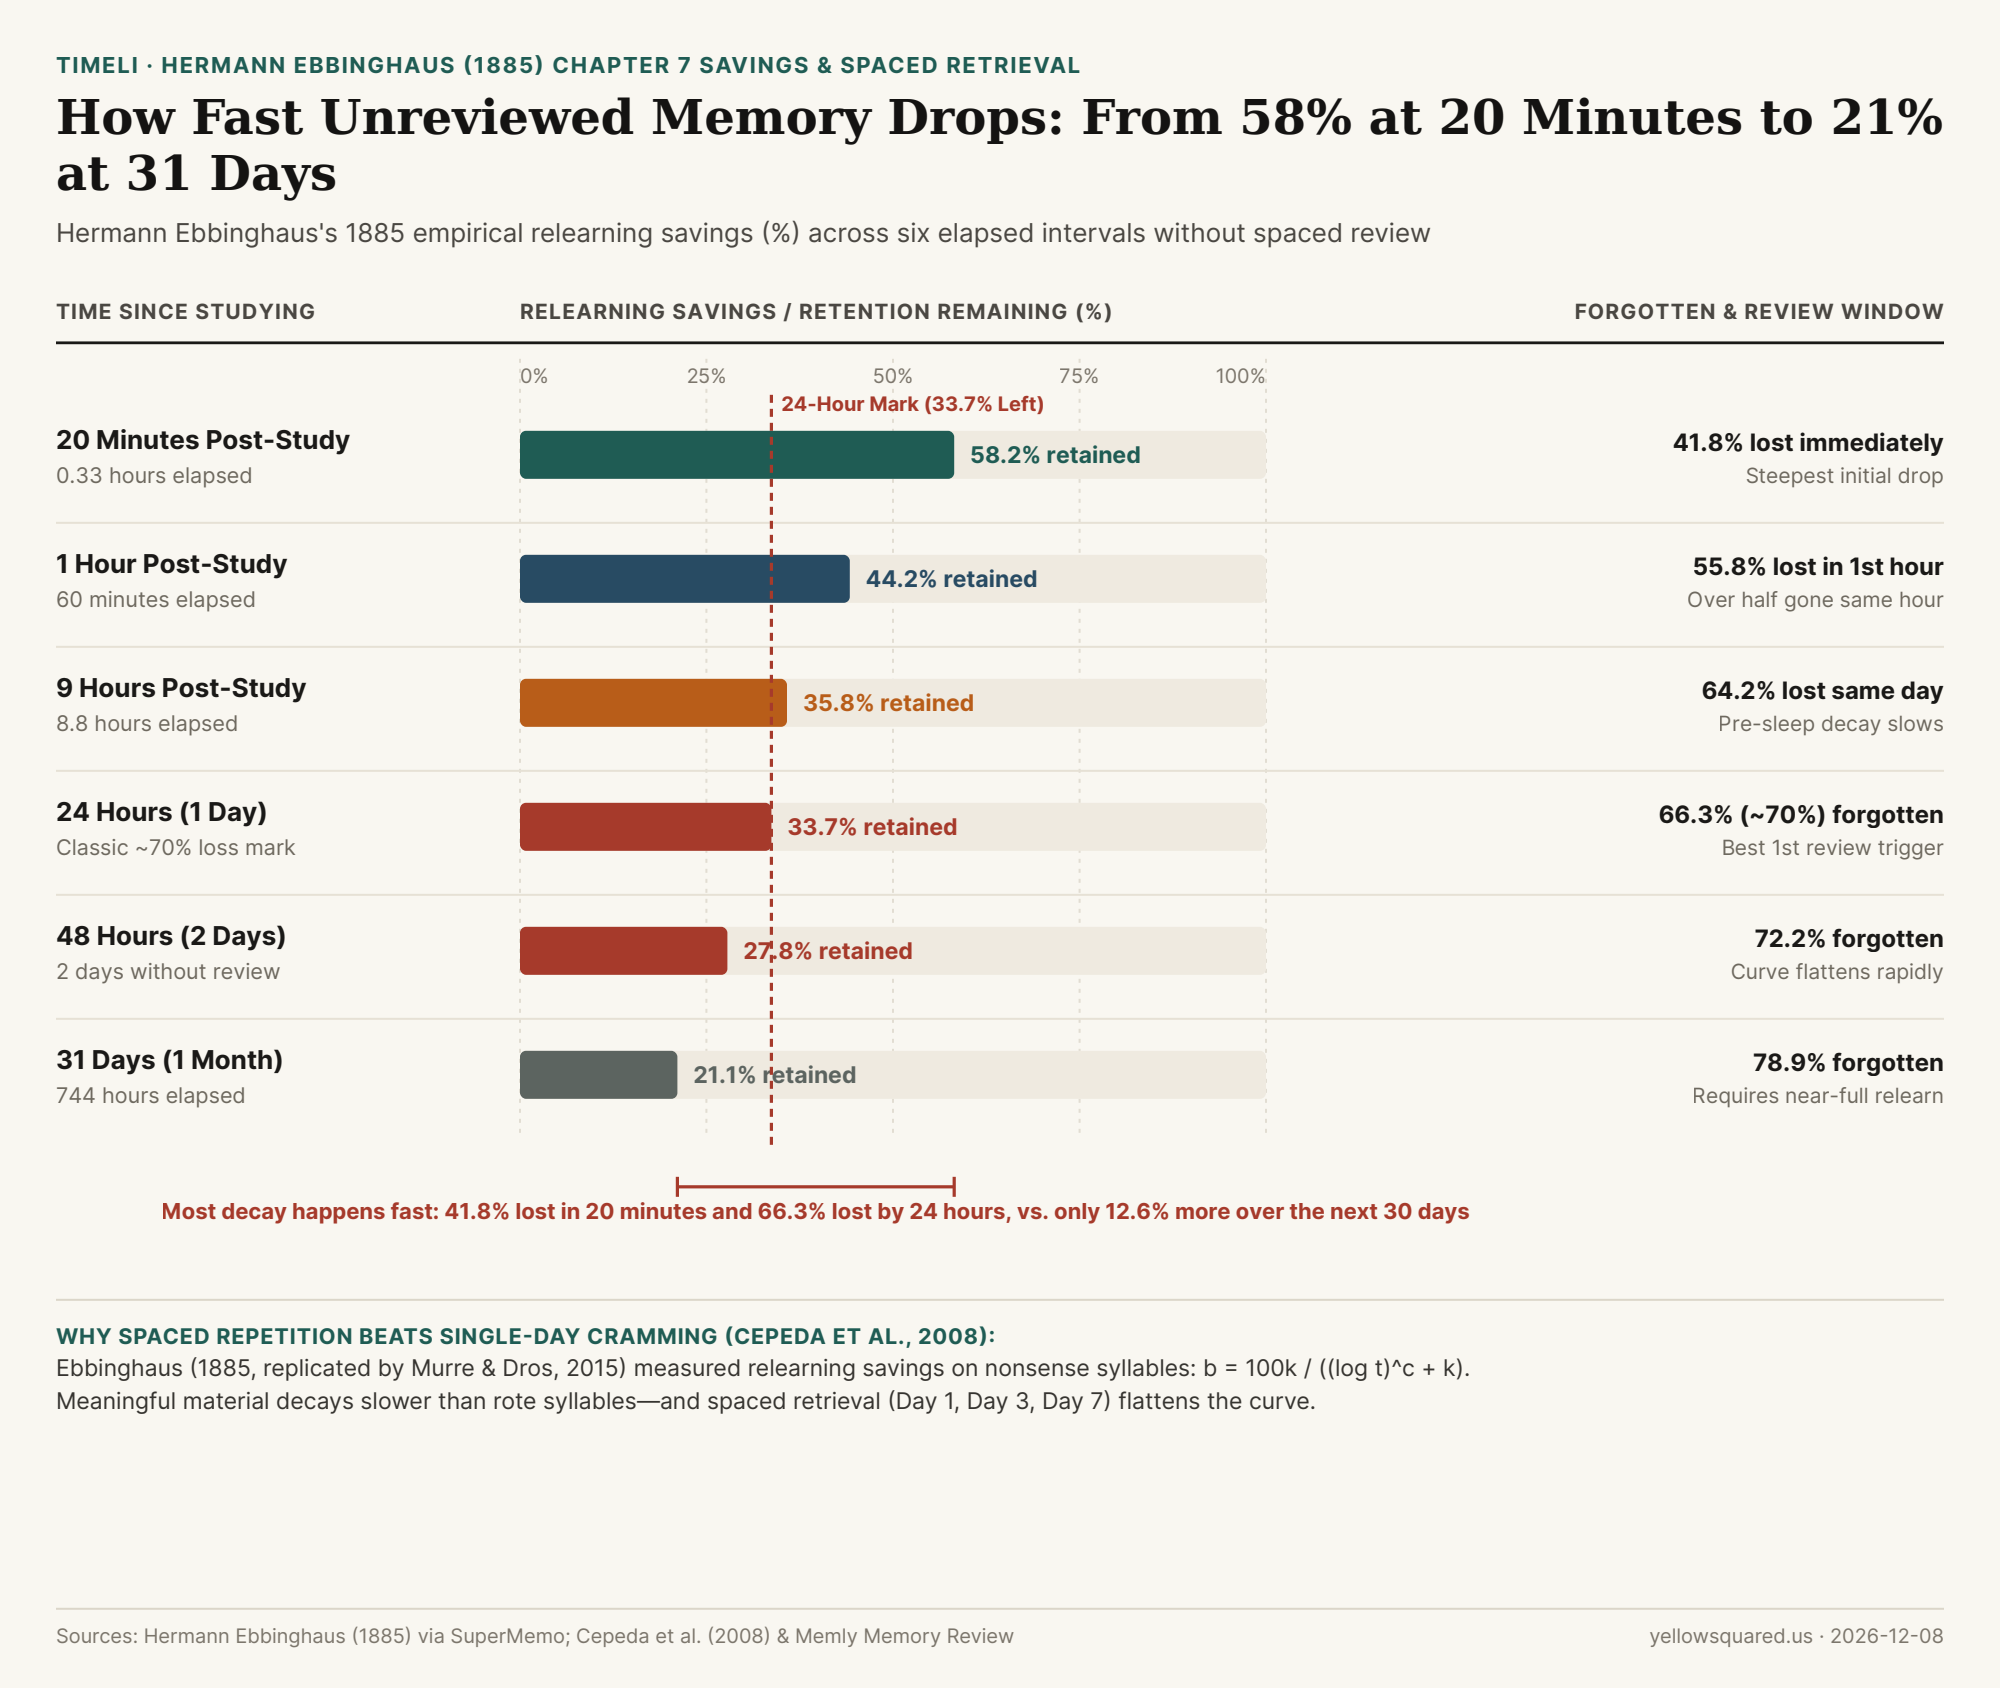
Horizontal comparison chart showing Hermann Ebbinghaus's 1885 empirical relearning savings dropping from 58.2% at 20 minutes and 44.2% at 1 hour to 33.7% at 24 hours and 21.1% at 31 days.
Figure 1: Hermann Ebbinghaus's 1885 empirical relearning savings (% retained) across six intervals from 20 minutes to 31 days without spaced review. Sources: Ebbinghaus Chapter 7 Savings Data (SuperMemo) and Cepeda et al. (2008) Review (Memly) · Download CSV dataset.

The 1885 Savings Formula: Where the "70% in 24 Hours" Figure Comes From

To measure pure memory decay without distortion from prior knowledge, Ebbinghaus spent years memorizing lists of 2,300 three-letter consonant-vowel-consonant nonsense syllables (like WID or ZOF) and timing how much faster he could relearn a list after a delay—a metric he called relearning savings (b):

b = 100k / ((log t)^c + k)

His empirical table revealed a steep logarithmic drop rather than a steady straight-line decline:

  • First 20 Minutes: Relearning savings dropped immediately to 58.2% (meaning 41.8% of effort was already lost).
  • 1 Hour: Savings fell to 44.2% (55.8% lost within the very first hour).
  • 9 Hours (8.8 hrs): Savings reached 35.8% (64.2% lost by bedtime).
  • 24 Hours (1 Day): Savings hit 33.7%—leaving roughly 66.3% (commonly rounded to ~70%) forgotten without review.
  • 31 Days (1 Month): The curve flattened out almost completely, hovering at 21.1% (78.9% lost).

"More memory is lost in the first 60 minutes after studying (55.8%) than over the entire next 30 days combined (an additional 23.1%)—which is why timing your very first review within 24 hours changes everything."

Important Nuance: Meaningful Knowledge Decays Slower Than Nonsense Syllables

While Ebbinghaus's ~70% 24-hour benchmark is a reliable warning for unreviewed rote facts (vocabulary, formulas, acronyms, or names), cognitive psychologists emphasize an important boundary: meaningful, connected material decays more slowly than isolated nonsense syllables. When you link a new concept to something you already understand—or test yourself with active recall rather than passive rereading—your starting retention curve starts higher and decays more gently.

Ebbinghaus Forgetting Curve & Spaced Review Table

The table below lists Ebbinghaus's exact Chapter 7 relearning savings across seven intervals alongside the corresponding spaced repetition intervention (download the raw CSV dataset):

Time Since Initial Learning Elapsed Hours Ebbinghaus Savings (%) Unreviewed Loss (%) Spaced Repetition Strategy
20 Minutes 0.33 hrs 58.2% 41.8% lost Close the book and summarize 3 key takeaways from memory
1 Hour 1.0 hr 44.2% 55.8% lost Quick 2-minute flashcard or self-quiz check
9 Hours (8.8 hrs) 8.8 hrs 35.8% 64.2% lost Sleep consolidates hippocampal traces into neocortex
24 Hours (1 Day) 24.0 hrs 33.7% 66.3% (~70%) lost Review #1: 5-minute active recall resets decay slope
48 Hours (2 Days) 48.0 hrs 27.8% 72.2% lost Review #2 (Day 3): Reconstruct core concepts without notes
6 Days 144.0 hrs 25.4% 74.6% lost Review #3 (Day 7): Final weekly consolidation check
31 Days (1 Month) 744.0 hrs 21.1% 78.9% lost Monthly maintenance review locks long-term recall

The 1-3-7 Spaced Study Schedule

Instead of spending 4 straight hours rereading notes on Sunday night, split that exact same time into four short active-recall sessions: 2.5 hours on Day 0, plus three 30-minute retrieval quizzes on Day 1, Day 3, and Day 7. Letting the memory partially fade between sessions forces your brain to work harder to retrieve it—and that "desirable difficulty" is what converts fragile short-term notes into durable long-term recall. Schedule spaced review blocks and study intervals in Timeli to automate your Day-1, Day-3, and Day-7 study blocks.
002 / 19

Why Do If-Then Plans (Implementation Intentions) Double Your Chances of Finishing a Goal?

Every Sunday evening, millions of people form sincere, high-motivation goal intentions: "I'm going to work out three times this week," "I'll finish my tax prep this weekend," or "I'll study Spanish every night." By Friday, roughly two-thirds of those intentions have evaporated—not because the person stopped caring about the outcome, but because a vague goal intention never specifies what environmental cue will trigger the action. In 1999, New York University and University of Konstanz psychologist Peter M. Gollwitzer formalized the antidote: the implementation intention, better known as an "If-Then" plan. Across a landmark 2006 meta-analysis of 94 independent studies (N = 8,461) by Gollwitzer and Paschal Sheeran and empirical habit trials synthesized by Habi's behavioral research review and Goals & Progress, translating a goal into a single "If [Situation X], then I will [Behavior Y]" sentence doubles—and in controlled trials nearly triples—real-world follow-through.

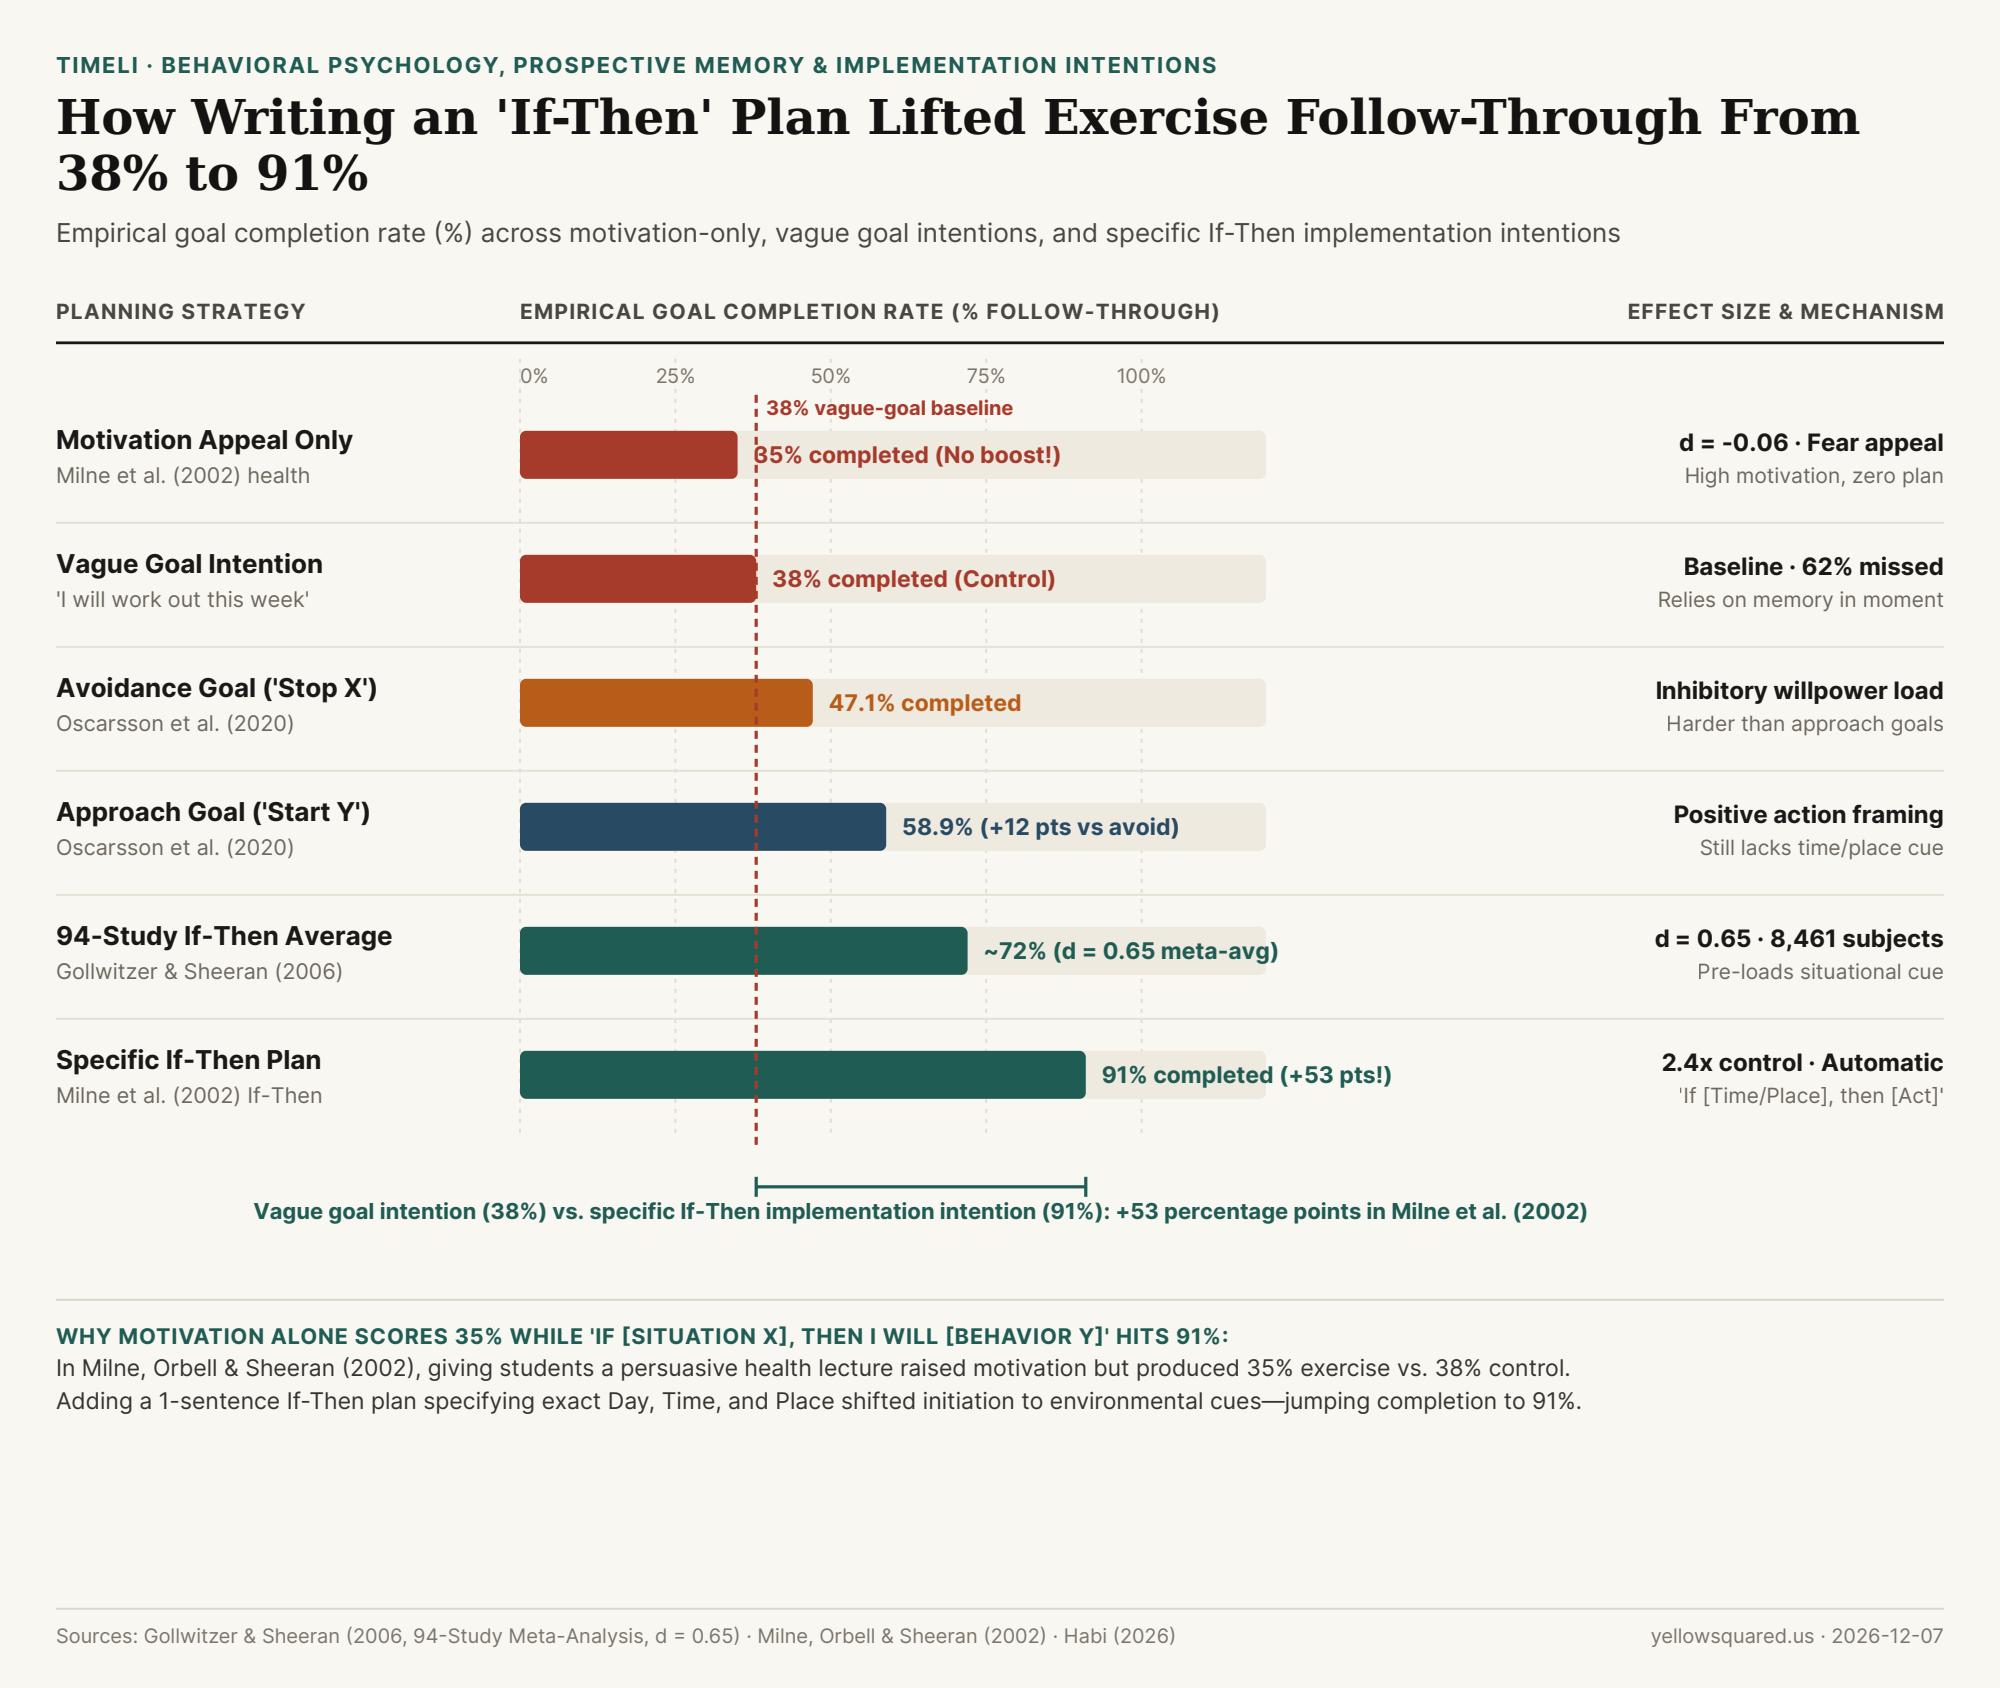
Chart comparing empirical goal completion rates across motivation-only appeals, vague goal intentions, avoidance vs approach framing, and specific If-Then implementation intentions
Figure 1: Empirical goal completion rate (%) across motivation-only controls, vague goal intentions, avoidance/approach framing, and specific If-Then implementation intentions. Data: Gollwitzer & Sheeran (2006 Meta-Analysis) and Milne, Orbell & Sheeran (2002) via Habi (download CSV).

The 2002 Milne, Orbell & Sheeran Experiment: 38% vs. 35% vs. 91%

To test whether people fail at habits because they lack motivation or because they lack a trigger mechanism, psychologists Sarah Milne, Sheina Orbell, and Paschal Sheeran (2002, British Journal of Health Psychology, summarized in Habi's habit statistics benchmark) divided 248 university students into three groups and tracked who actually completed at least one 20-minute vigorous exercise session over the following week:

  1. Group 1 — Control Group (38% Exercised): Participants simply tracked their baseline exercise behavior without receiving persuasive materials or writing a specific trigger plan. Only 38% followed through; 62% did not.
  2. Group 2 — High-Motivation / Threat-Appeal Group (35% Exercised): Participants read an evidence-backed medical briefing detailing how regular aerobic exercise reduces coronary heart disease risk. Post-test questionnaires confirmed that their conscious motivation and intention to exercise surged significantly—yet when the week ended, only 35% actually exercised! Firing up willpower and fear of disease accomplished zero behavioral change.
  3. Group 3 — Motivation + One-Sentence "If-Then" Implementation Intention (91% Exercised!): Participants received the exact same health briefing, plus one extra instruction: complete the sentence, "During the next week, I will partake in at least 20 minutes of vigorous exercise on [Day or Days] at [Time of Day] at/in [Place]." Follow-through skyrocketed from 35%–38% to 91%—a 53-percentage-point jump from a single sentence of spatial-temporal specificity!

"In Milne, Orbell, and Sheeran's trial, raising motivation alone produced 35% follow-through (worse than the 38% control group). Adding a specific When-and-Where 'If-Then' plan drove completion to 91%."

How "If-Then" Plans Rewire Prospective Memory Across 94 Studies (d = 0.65)

Why does writing "If it is 7:30 AM on Monday after I pour my coffee, then I will open my code editor and work on Module A for 45 minutes" work so much better than "I'll work on Module A on Monday"? In their 2006 meta-analysis of 94 independent tests (Cohen's d = 0.65) and subsequent cognitive neuroscience studies, Gollwitzer and Sheeran identified two distinct neural mechanisms:

  • 1. Heightened Accessibility of the Situational Cue ("If X"): When you specify a concrete external trigger—a clock time, a physical room, or the completion of an existing routine (e.g., "After I close my laptop at 5:30 PM...")—your brain holds a mental representation of that cue in a state of heightened perceptual readiness. You spot the opportunity immediately even when busy or tired, solving the #1 cause of failed goals: prospective memory failure ("forgetting to act at the right moment").
  • 2. Automatized Action Initiation ("Then Y" — Zero Deliberation Gap): A vague goal forces your prefrontal cortex to negotiate with itself in the moment ("Should I work out now, or after dinner? What workout should I do?")—and during that 5-second deliberation window, fatigue and distraction win. An implementation intention pre-loads the decision ahead of time, creating an automatic associative link (Cue X → Action Y) that initiates behavior rapidly without conscious willpower.
  • 3. Combining Approach Framing (58.9%) With Coping Intentions: As Oscarsson et al. (2020) demonstrated across 1,066 participants (Habi), framing a goal as an approach behavior (58.9% success) beats an avoidance behavior (47.1% success) by nearly 12 points—and pairing your primary If-Then plan with a backup coping intention ("If my 7:00 AM slot gets interrupted by a meeting, then I will do a 20-minute session at 12:15 PM") keeps a single disruption from breaking your streak.
Goal-Setting Strategy Empirical Study & Sample Completion Rate Effect Size (d) Cognitive Initiation Mechanism
Motivation Appeal Only Milne et al. (2002, N=248) 35.0% d = -0.06 (Null) High desire, but zero situational cue
Vague Goal Intention Milne et al. (2002, N=248) 38.0% Baseline (0.00) Relies on effortful prospective memory
Avoidance Goal ("Stop X") Oscarsson et al. (2020, N=1,066) 47.1% d = 0.24 (Small) Continuous inhibitory self-control load
Approach Goal ("Start Y") Oscarsson et al. (2020, N=1,066) 58.9% d = 0.48 (Medium) Positive target, but lacks when/where link
94-Study If-Then Meta-Avg Gollwitzer & Sheeran (2006, N=8,461) ~72.0% d = 0.65 Pre-loaded cue detection + automatic start
Specific If-Then Plan Milne et al. (2002, N=248) 91.0% d = 1.25 (Large) Exact Day + Time + Place stimulus control

How to Turn Your Daily To-Do List Into Concrete "If-Then" Time Blocks

Instead of writing a floating checklist item like "Write quarterly review" or "Go for a run," anchor every priority to a specific When, Where, and Preceding Cue: "If it is 9:00 AM at my desk after I silence my phone, then I will draft the first section for 30 minutes." Plan daily focus blocks and specific action cues in Timeli to turn intentions into finished sessions.

003 / 19

How Much Time Do You Lose When Switching Between Tasks, and How Do Goal Shifting and Rule Activation Work?

When we bounce between writing code, answering a Slack message, and checking a spreadsheet, it feels as though our attention pivots instantaneously. Yet in August 2001, psychologists Joshua S. Rubinstein, David E. Meyer, and Jeffrey E. Evans published a landmark four-experiment study in the Journal of Experimental Psychology: Human Perception and Performance (full 2001 JEP:HPP paper PDF; PubMed PMID 11518143) proving that the human brain's executive control system cannot switch tasks in a single step. As summarized in the American Psychological Association (APA) research brief on multitasking switching costs and the APA Monitor on Psychology report, every context switch forces the prefrontal and parietal cortices through two distinct, time-consuming stages—Goal Shifting and Rule Activation—that slow task completion by 18% to over 55% per switch and can consume up to 40% of a person's productive workday.

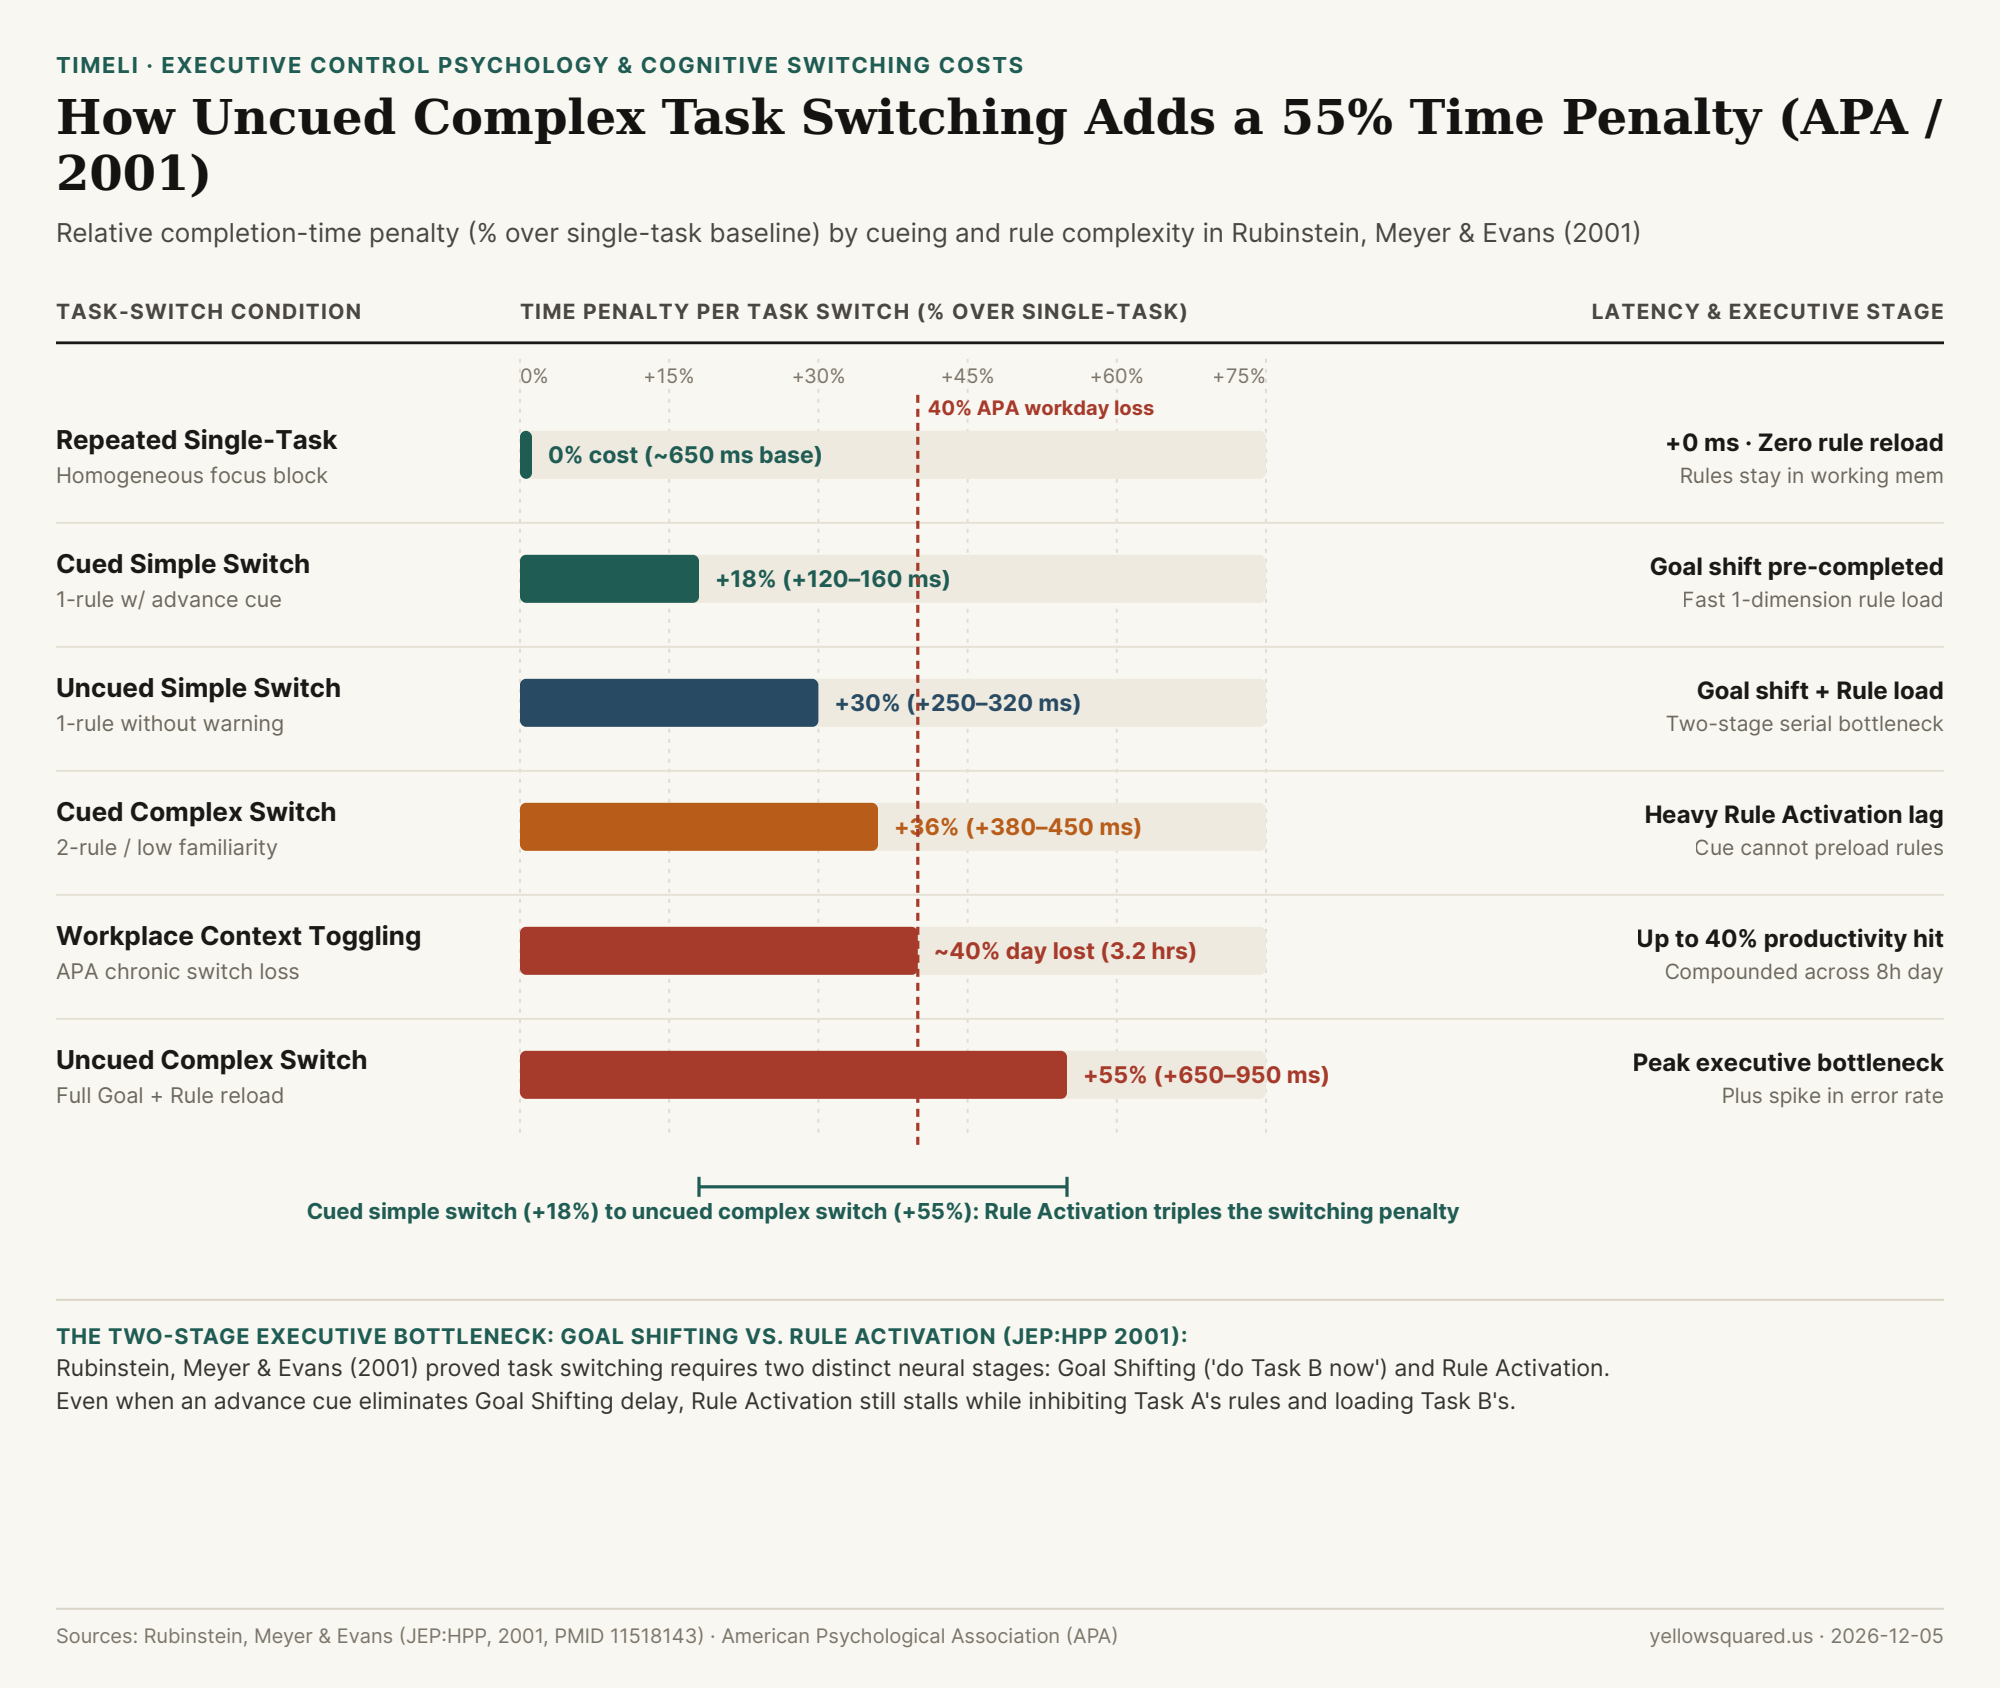
Chart showing relative task-switching completion time penalties by advance cueing and rule complexity from Rubinstein, Meyer, and Evans 2001 APA study
Figure 1: Relative completion-time penalty (% over single-task baseline) across cueing and rule-complexity conditions, alongside the compounded 40% workday productivity loss reported by the APA. Data: Rubinstein, Meyer & Evans (JEP:HPP, 2001) and American Psychological Association (download CSV).

The Two-Stage Executive Control Model: Goal Shifting vs. Rule Activation

Prior to Rubinstein, Meyer, and Evans (2001), cognitive scientists debated whether "switching cost"—the extra time and higher error rate observed whenever a participant alternates between Task A (such as classifying geometric objects by shape) and Task B (classifying them by color or solving alternating math operations)—was merely passive decay from the previous trial or an active executive-control bottleneck. By independently manipulating advance task cues (telling participants which task was coming next before the stimulus appeared) and rule complexity (simple 1-dimension rules vs. complex 2-dimension conjunction or unfamiliar arithmetic rules), the authors isolated two separate neural stages:

  1. Stage 1 — Goal Shifting (Prefrontal Declarative Control): The executive decision to update working memory's current intention: "I want to perform Task B now instead of Task A." When participants are given an advance cue (sufficient preparation time before the next problem appears), Goal Shifting can be completed ahead of time, shrinking the switching penalty on simple tasks down to ~18% (+120 to +160 ms).
  2. Stage 2 — Rule Activation (Posterior Parietal & Anterior Cingulate Procedural Reload): Even after your conscious goal has shifted to Task B, a second executive process must actively inhibit the procedural rules of Task A ("turn off the multiplication or shape-sorting rules") and load the procedural rules of Task B into procedural working memory. Crucially, Rubinstein, Meyer, and Evans discovered that Rule Activation cannot finish until the actual task stimulus arrives—and its time cost explodes as tasks become more complex or less familiar, surging from +30% (+250 to +320 ms) on uncued simple switches to +55% or more (+650 to +950 ms) on uncued complex switches.

"Although switch costs may be relatively small—sometimes just a few tenths of a second per switch—they can add up to large amounts when people switch repeatedly back and forth between tasks, costing as much as 40 percent of someone's productive time." — American Psychological Association (APA)

Why Tenths of a Second in the Lab Compound Into 3.2 Lost Hours at Work

In a controlled laboratory card-sorting or arithmetic trial where a single problem takes 650 milliseconds, adding 350 to 900 milliseconds for Goal Shifting and Rule Activation already represents a 40% to 60%+ slowdown on every switched trial. In real-world software engineering, writing, and analytical workflows, the Rule Activation stage is vastly heavier than loading a geometric sorting rule:

  • Working-Memory Rule Reloading in Deep Work: When you switch from debugging a state machine to replying to an email thread and then back to code, "Rule Activation" requires reconstructing variable invariants, call-stack context, and edge-case constraints in working memory.
  • The 40% Workday Tax: As the APA's synthesis of Meyer and Rubinstein's findings emphasizes, chronic task-switching across an 8-hour workday consumes up to 40% of productive capacity—equivalent to losing 3.2 hours every single day solely to executive-control reloading and error correction.
Task-Switching Condition Rule Complexity & Cueing Time Penalty (%) Added Switch Latency Active Executive Control Stages
Repeated Single-Task Single rule · Zero switching 0% 0 ms (~650 ms base) Task execution only; procedural rules remain active
Cued Simple Switch 1-dimension rule · Advance cue +18% +120 to +160 ms Goal shifting completed pre-stimulus; fast rule load
Uncued Simple Switch 1-dimension rule · No cue +30% +250 to +320 ms Serial Goal Shifting + simple Rule Activation
Cued Complex Switch 2-dimension / unfamiliar · Cued +36% +380 to +450 ms Post-stimulus complex Rule Activation bottleneck
Workplace Context Toggling Chronic daily task interleaving ~40% ~3.2 hrs / 8h day Compounded Goal Shifting + Rule Activation + errors
Uncued Complex Switch 2-dimension / unfamiliar · No cue +55% +650 to +950 ms Full Goal Shifting + heavy Rule Activation reload

How to Eliminate Rule-Activation Overhead in Your Daily Schedule

Rubinstein, Meyer, and Evans's data points directly to two practical defenses against cognitive switching loss: first, batch homogeneous tasks together (processing all messages or administrative reviews in a single contiguous window so your brain loads that rule set once instead of 30 times); second, use explicit transition cues (writing down a one-line next-step note before stepping away from a complex problem so Goal Shifting and Rule Activation have an external anchor when you return). Log daily focus blocks and moments in Timeli to spot fragmented context-switching windows and protect uninterrupted deep-work sessions.

004 / 19

What Is Hick's Law, and Why Does Having Too Many Choices Slow Down Decision-Making?

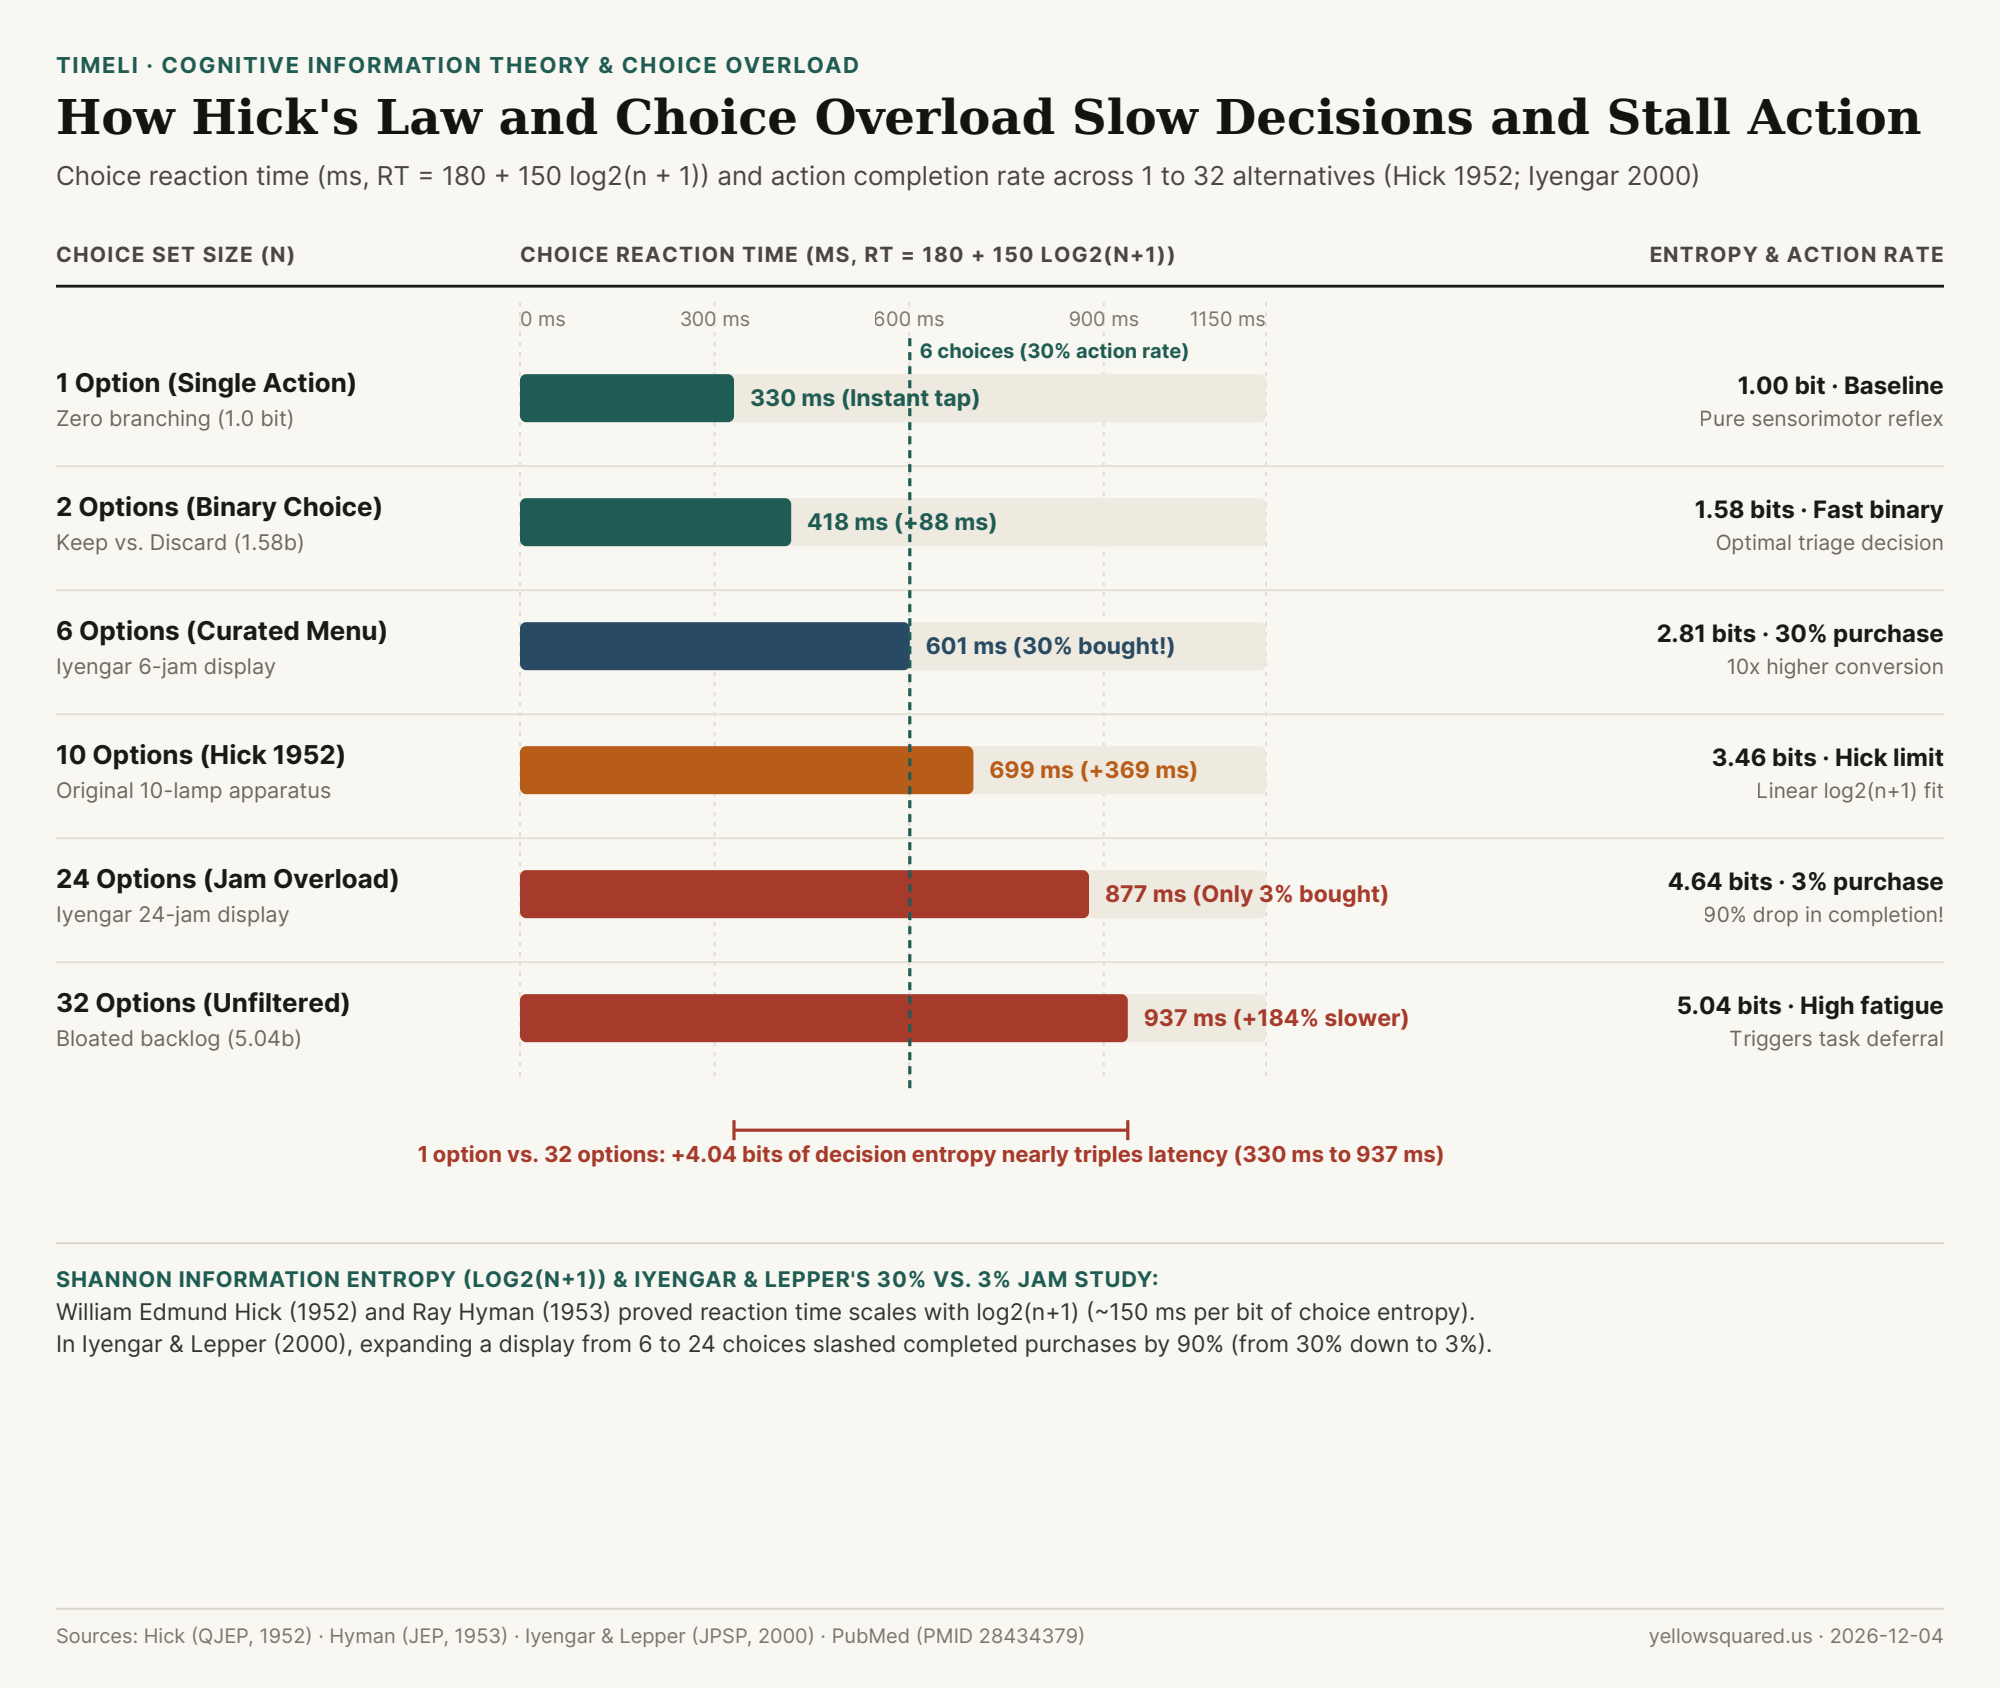
Open a task manager with 32 unprioritized to-do items—or a software toolbar packed with 24 competing buttons—and you will feel a distinct mental stall before you even click. You are not lazy; your prefrontal cortex is paying an information-processing tax first quantified more than seventy years ago as Hick's Law (also known as the Hick–Hyman Law).

In 1952, British experimental psychologist William Edmund Hick measured how long human subjects took to press a key corresponding to 1 of up to 10 pea-lamps that lit up at random, and in 1953 American psychologist Ray Hyman extended the experiment by varying the probability of each lamp. As reviewed in the Quarterly Journal of Experimental Psychology's retrospective on Hick's Law, Hick and Hyman discovered that human choice reaction time does not grow linearly with the raw number of options—it grows linearly with the Shannon information entropy (measured in binary bits, log2) of the choice set. To eliminate choice paralysis in your own daily workflow, you can Log daily focus blocks and moments in Timeli using a single-tap stream rather than a bloated multi-screen form.

Horizontal bar chart showing choice reaction time in milliseconds (RT = 180 + 150 log2(n+1)) and action completion rates across 1, 2, 6, 10, 24, and 32 options.
Figure 1: Choice reaction time (ms) and Shannon entropy (bits) across 1 to 32 alternatives under Hick's Law, paired with Iyengar and Lepper's (2000) 6-vs-24 jam purchase conversion rates. Source: Hick (1952, QJEP Review), Wikipedia (Hick's law), and Iyengar & Lepper (JPSP, 2000).

The Binary Tree Inside Your Brain: Why RT = a + b log2(n + 1)

When presented with n equally probable choices, the Hick–Hyman equation predicts the time (RT) required to initiate a response:

RT = a + b × log2(n + 1)

Here, a represents the baseline sensorimotor latency (~180 to 200 milliseconds to perceive the stimulus and move a finger), b represents the cognitive processing speed per bit of information (typically ~150 milliseconds per bit, equivalent to an information gain rate of ~6.5 bits per second), and the + 1 inside log2(n + 1) accounts for the extra uncertainty of deciding whether a stimulus has appeared at all (the "no-signal" state). Because the relationship is logarithmic (base 2), your brain effectively performs a binary search—eliminating half of the remaining possibilities at each step:

  • 1 Option (1.00 bit): 180 + 150 × log2(2) = 330 ms. Zero branching friction.
  • 2 Options (1.58 bits): 180 + 150 × log2(3) = 418 ms (+88 ms to resolve a binary Keep vs. Discard decision).
  • 6 Options (2.81 bits): 180 + 150 × log2(7) = 601 ms.
  • 10 Options (3.46 bits): 180 + 150 × log2(11) = 699 ms (more than double the latency of a 1-option trigger).
  • 32 Options (5.04 bits): 180 + 150 × log2(33) = 937 ms (nearly a full second for a simple recognition choice—and several minutes when options require subjective trade-off evaluation).

"In Hick's Law, every doubling of choices adds one full bit of information entropy to your working memory; in complex real-world tasks, expanding a list from 6 options to 24 options doesn't just slow you down—it causes 90% of people to walk away without choosing at all."

From Milliseconds to Paralysis: The 2000 Iyengar & Lepper Jam Experiment

While Hick's 1952 pea-lamp apparatus measured simple stimulus-response matching in milliseconds, psychologists Sheena S. Iyengar and Mark R. Lepper tested what happens when choice sets expand in everyday human decision-making. In their famous 2000 study published in the Journal of Personality and Social Psychology, researchers rotated two sample displays of Wilkin & Sons gourmet jams at an upscale California grocery store: an Extensive-Choice booth with 24 jam flavors (4.64 bits) and a Limited-Choice booth with 6 jam flavors (2.81 bits).

The results exposed a dramatic split between initial curiosity and actual execution: while the 24-jam table attracted more browsers (60% of passersby stopped vs. 40% at the 6-jam table), only 3% of customers at the 24-jam booth actually bought a jar. At the 6-jam booth, 30% of visitors bought a jar—a tenfold (10x) increase in completed action when the choice set was capped at 6 options!

Choice Set Size (n) Shannon Entropy Hick Reaction Time Latency Increase Empirical Benchmark & Action Outcome
1 Option (Single Action) 1.00 bit 330 ms +0.0% (Baseline) Single-tap logging or pre-committed next task
2 Options (Binary Triage) 1.58 bits 418 ms +26.7% Binary swipe (Keep vs. Delete) maximizes throughput
6 Options (Curated Set) 2.81 bits 601 ms +82.1% Iyengar & Lepper 6-jam booth: 30.0% completed purchase
10 Options (Hick 1952) 3.46 bits 699 ms +111.8% Hick's 10-lamp apparatus; upper limit for quick scan
24 Options (Overload) 4.64 bits 877 ms +165.8% Iyengar & Lepper 24-jam booth: only 3.0% completed purchase
32 Options (Backlog) 5.04 bits 937 ms +183.9% Unfiltered task backlog; triggers procrastination & exit

How to Apply Hick's Law to Your Daily Task List and UI Design

Whether you are designing a mobile interface or structuring your own morning routine, Hick's Law and the Iyengar–Lepper threshold prescribe the same rule: never force your brain to evaluate a 24-item menu in real time. Group secondary tools into progressive disclosure layers of 3 to 5 items, convert complex sorting chores into rapid 2-choice binary decisions, and cap your active daily work queue at 3 to 6 concrete priorities. To capture observations and work sessions without menu friction, Log daily focus blocks and moments in Timeli with a single tap.

005 / 19

What Is the Planning Fallacy, and Why Do Projects Almost Always Take Longer Than We Estimate?

Ask an experienced software engineer, academic researcher, or home-renovation contractor how long an upcoming project will take—even when they know similar past projects ran weeks behind schedule—and they will almost always produce an optimistic deadline that slips. In behavioral economics and cognitive psychology, this systematic bias is known as the planning fallacy. First formulated by Daniel Kahneman and Amos Tversky in 1979, the planning fallacy describes our tendency to underestimate task-completion times by mentally simulating an ideal, step-by-step execution scenario while discounting historical base rates of interruptions, bugs, and competing commitments.

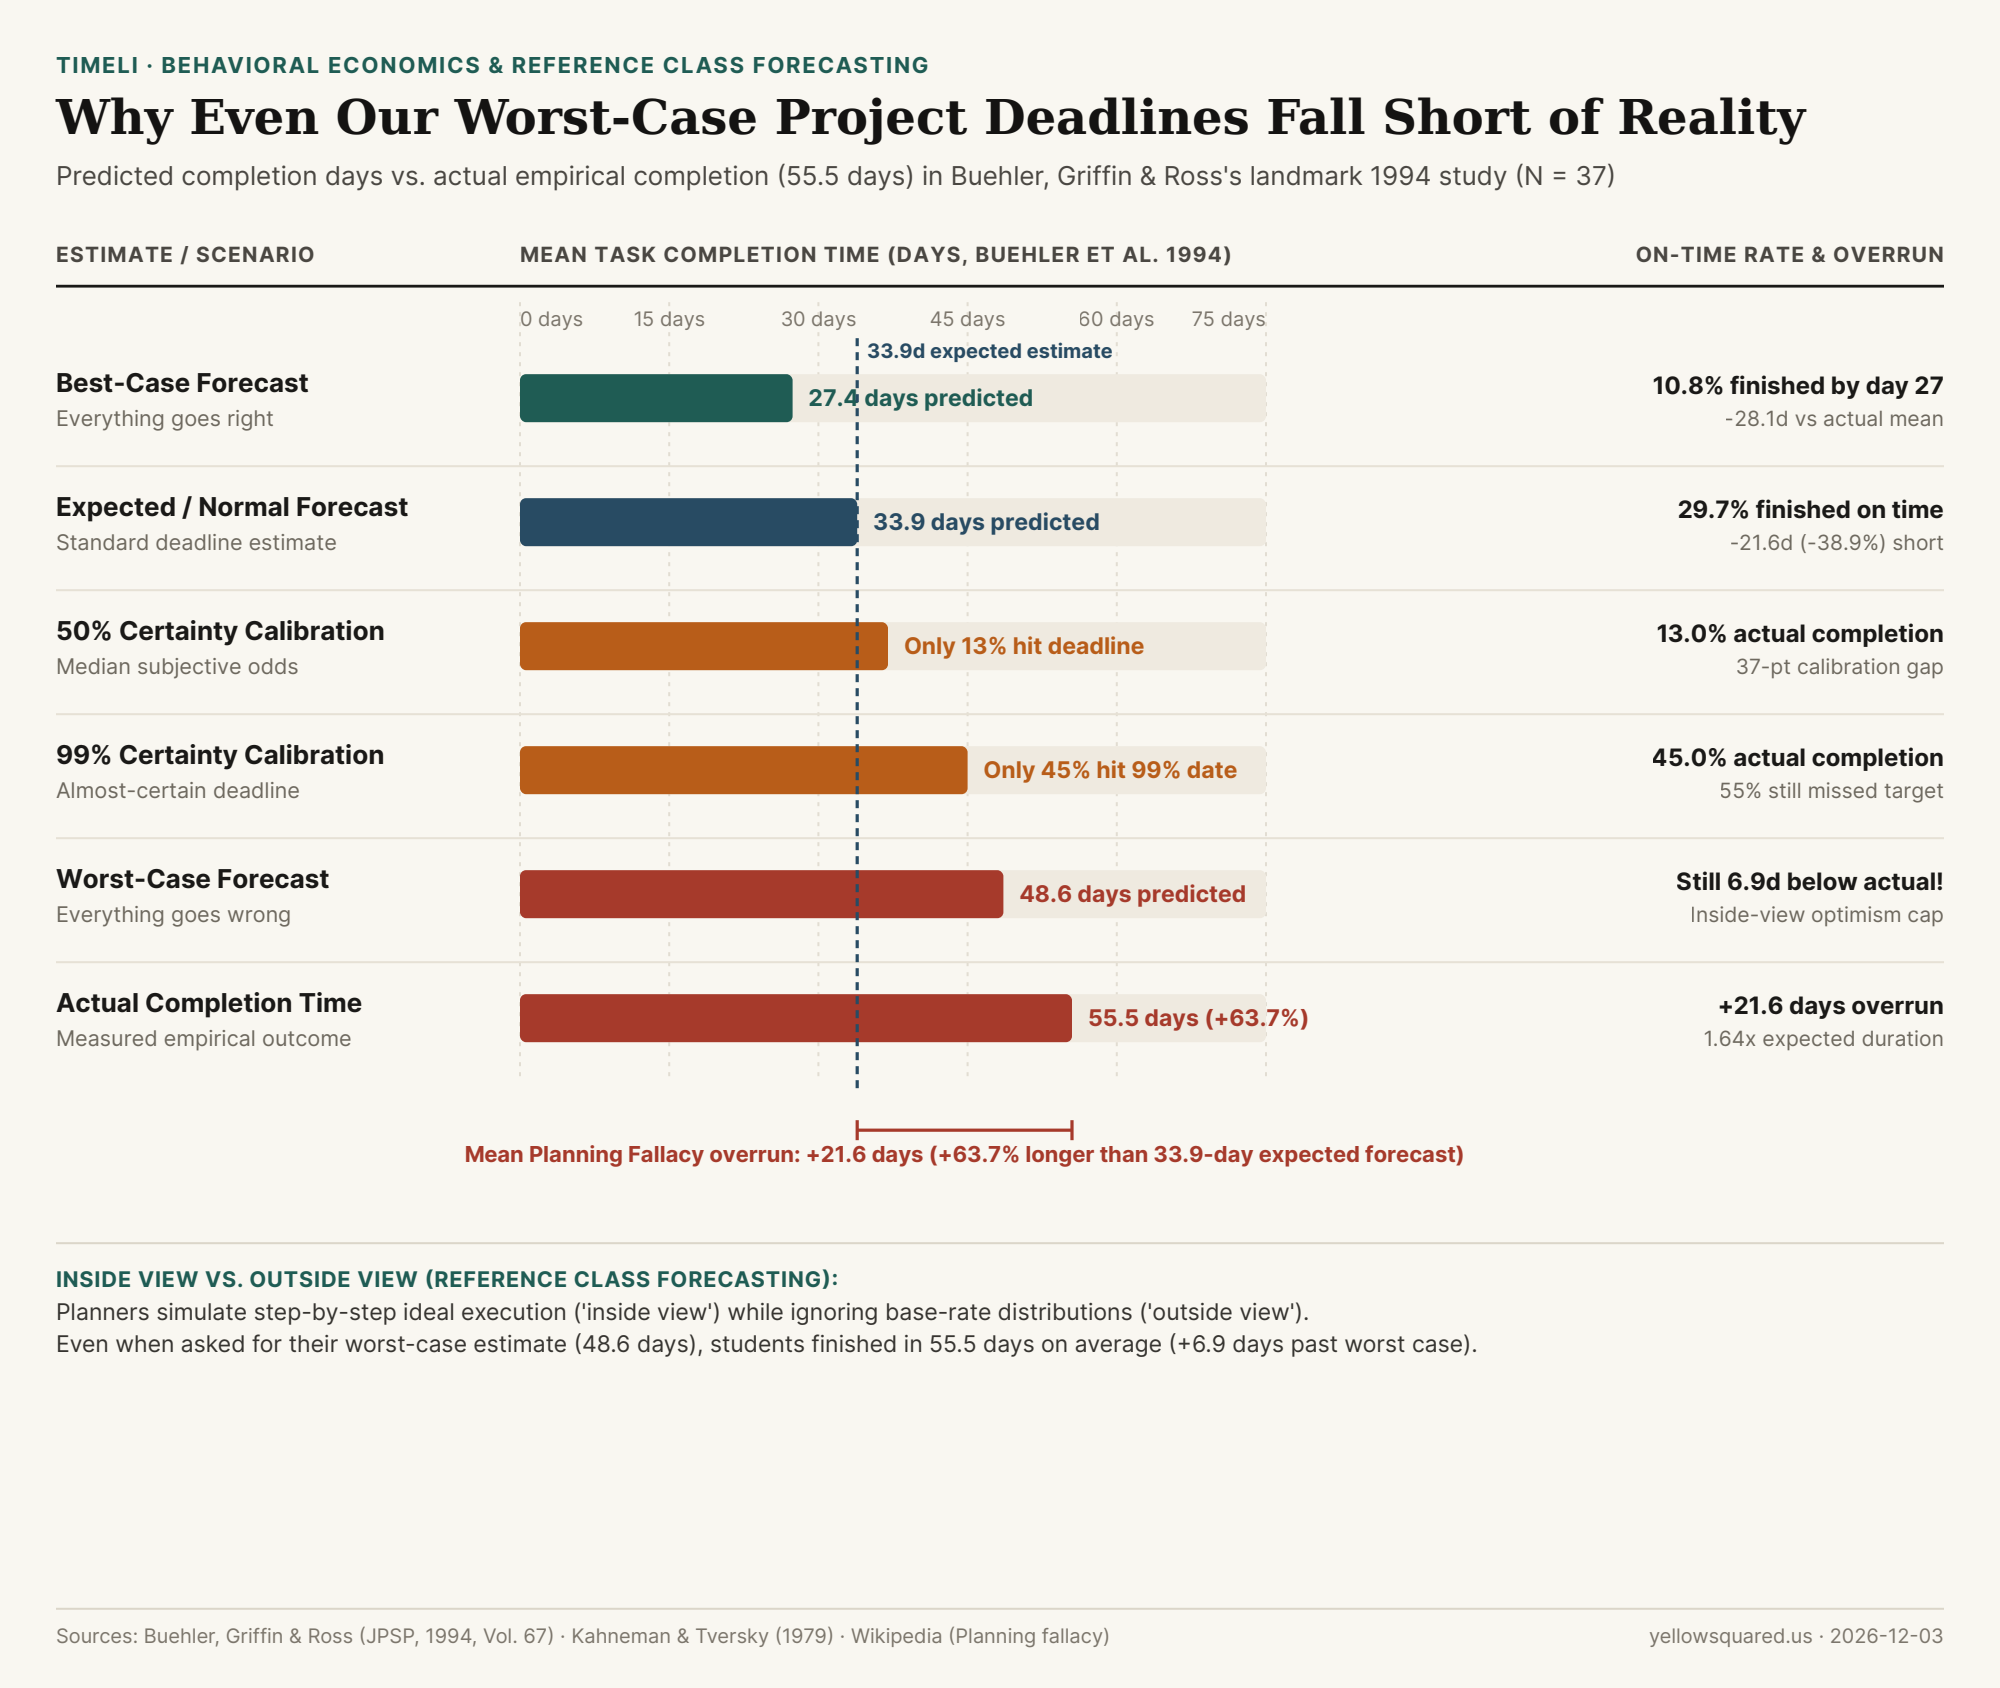
The empirical scale of this bias was measured in a landmark 1994 study by psychologists Roger Buehler, Dale Griffin, and Michael Ross, published in the Journal of Personality and Social Psychology (1994, Vol. 67, No. 3). When tracking N = 37 senior psychology students completing their honors theses, Buehler and colleagues found that students predicted their projects would take an average of 33.9 days—yet actual completion took an average of 55.5 days, a mean overrun of +21.6 days (`+63.7%` longer than predicted). Even more remarkably, the actual mean completion time (`55.5 days`) exceeded the students' average worst-case estimate (`48.6 days`) by nearly a full week (`+6.9 days`). To replace optimistic memory with empirical base rates on your own daily work, you can Log daily focus blocks and moments in Timeli to build an objective timeline of how long tasks actually take.

Horizontal bar chart comparing best-case (27.4 days), expected (33.9 days), 50% and 99% probability calibrations, worst-case (48.6 days), and actual mean completion time (55.5 days) in Buehler, Griffin & Ross (1994).
Figure 1: Predicted vs. actual task completion durations and on-time completion rates across Buehler, Griffin, and Ross's honors-thesis cohort (N = 37) and probability calibration follow-ups. Source: Buehler, Griffin & Ross (JPSP, 1994) and Wikipedia (Planning fallacy).

Inside the 1994 Buehler, Griffin & Ross Experiments: Why Even 99%-Certain Deadlines Fail

In Study 1 of Buehler, Griffin, and Ross's JPSP paper, researchers asked participants to estimate three distinct completion horizons: when they would finish "if everything went as well as it possibly could" (`27.4 days`), when they expected to finish (`33.9 days`), and when they would finish "if everything went as poorly as it possibly could" (`48.6 days`). Only 10.8% of students finished by their best-case date, only 29.7% (`roughly 3 in 10`) finished by their expected date, and barely half (`51.4%`) finished even by their self-defined worst-case catastrophe date.

To test whether people were simply stating aspirational targets rather than true statistical medians, follow-up calibration studies asked participants to specify deadlines at which they were 50% certain, 75% certain, and 99% ("almost completely") certain they would be done:

  • 50% Subjective Probability Deadline: Only 13% of participants actually finished on time (a 37-percentage-point overconfidence gap).
  • 75% Subjective Probability Deadline: Only 19% finished on time (a 56-percentage-point overconfidence gap).
  • 99% Subjective Probability Deadline: Only 45% finished on time—meaning 55% of participants missed a deadline they believed had only a 1-in-100 chance of slipping.

"When planners construct a timeline, they adopt the 'inside view'—mentally walking through the specific steps required to succeed—which automatically excludes the combinatorial tail of unexpected bugs, illness, scope creep, and competing priorities."

The Inside View vs. Outside View (Reference Class Forecasting)

Why doesn't past experience automatically cure the planning fallacy? When Buehler, Griffin, and Ross recorded think-aloud protocols while participants generated estimates, they discovered two cognitive mechanisms that insulate future forecasts from past overruns:

  1. Singular ("Inside View") Mental Simulation: Only 7% of verbalized thoughts during estimation referenced past completion times on similar tasks (`distributional / outside-view data`). Instead, planners focused exclusively on the unique mechanics of the current task and how they intended to execute it.
  2. External Attribution of Past Delays: When reminded of past missed deadlines, participants attributed those delays to one-off external accidents ("my computer crashed that week" or "a client had an emergency") that they assumed would not recur—forgetting that while the exact same interruption rarely repeats, some interruption from the broader distribution almost always occurs.
Forecast Type / Calibration Level Predicted / Calibrated Duration Empirical Actual Mean On-Time Completion Rate Mean Overrun / Multiplier
Best-Case Estimate ("Everything goes well") 27.4 days 55.5 days 10.8% +28.1 days (2.03x best-case)
Expected / Standard Estimate 33.9 days 55.5 days 29.7% +21.6 days (1.64x / +63.7%)
50% Probability Calibration ~37.0 days 55.5 days 13.0% 37-pt calibration shortfall
75% Probability Calibration ~41.5 days 55.5 days 19.0% 56-pt calibration shortfall
99% Probability Calibration ("Almost certain") ~45.0 days 55.5 days 45.0% 55% still missed 99% deadline
Worst-Case Estimate ("Everything goes poorly") 48.6 days 55.5 days 51.4% +6.9 days beyond worst-case

How to Apply a 1.64x Reference-Class Multiplier to Your Schedule

To defeat the planning fallacy, Daniel Kahneman and Dan Lovallo formalized Reference Class Forecasting: instead of summing idealized task steps, look up the empirical distribution of how long your last five comparable projects actually took from start to finish, and multiply your initial inside-view estimate by your historical overrun ratio (in Buehler et al.'s baseline, 55.5 / 33.9 = 1.64x). By taking five seconds to Log daily focus blocks and moments in Timeli whenever you start and finish a milestone, you replace wishful memory with an exact personal reference class.

006 / 19

How Long Does It Take to Refocus After an Interruption? The 23-Minute Cost of Context Switching and Attention Residue

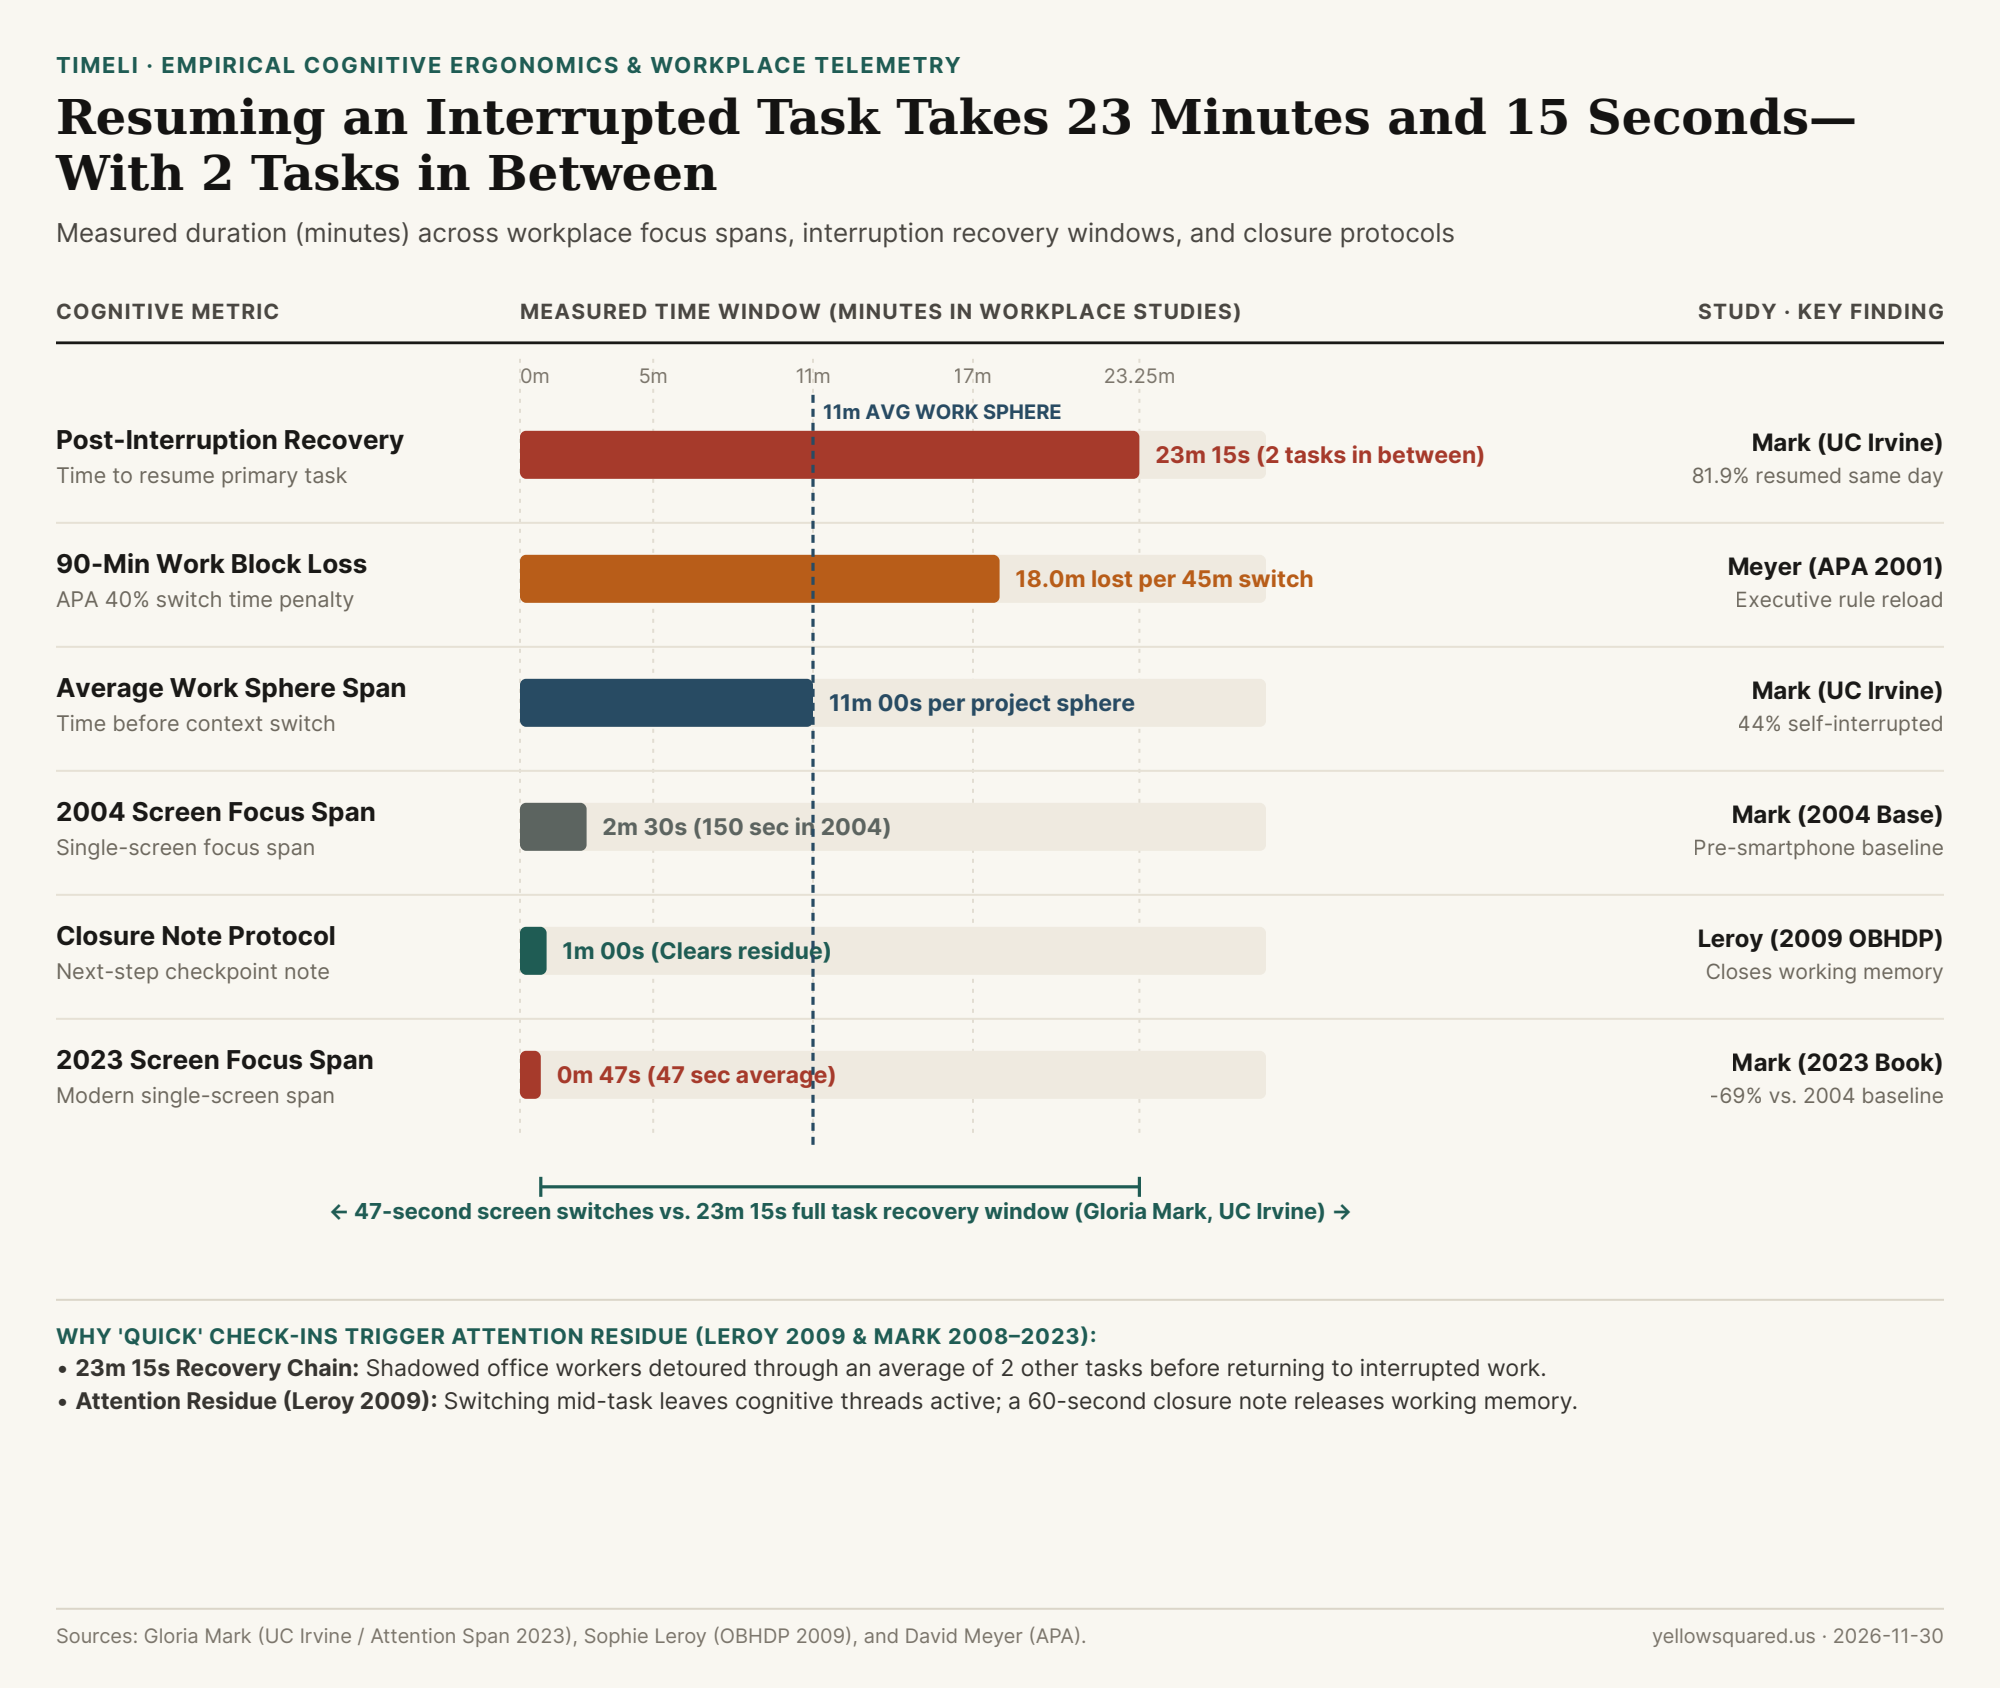
You are 30 minutes into debugging a tricky state transition or drafting a technical spec when a colleague pings you with a "quick 30-second question." You reply in under a minute and turn back to your editor—yet twenty minutes later, you have checked two email threads, glanced at a pull request, and still haven't reconstructed the mental model you held before the ping. When informatics professor Gloria Mark and her research team at the University of California, Irvine shadowed office workers with stopwatches and computer-logging telemetry to measure how long it actually takes to resume an interrupted task in the real world, the average wasn't two minutes or five minutes: it was 23 minutes and 15 seconds.

Reader outcome: You will learn what actually happens inside that 23-minute, 15-second recovery window, how attention residue (Sophie Leroy, 2009) degrades IQ and error rates when you switch mid-task, and how a 60-second "ready-to-resume" closure log lets you switch contexts without losing half your afternoon.

Chart comparing the 23-minute 15-second post-interruption recovery window, 11-minute average work sphere duration, 47-second modern screen attention span, and 60-second closure protocol
Across empirical workplace shadowing and laboratory studies, an interrupted task takes an average of 23 minutes and 15 seconds to resume—because workers detour through an average of two other tasks before returning. Data: Download CSV dataset.

What Actually Happens Inside the 23-Minute, 15-Second Recovery Window?

A common misconception is that a human brain sits staring blankly at a monitor for 23 straight minutes after a Slack message. In reality, Gloria Mark's UC Irvine observational studies revealed a structural behavioral chain across office engineering and management teams:

  • The 11-Minute "Work Sphere" Fragmentation: Mark grouped related tasks (such as reading a spec, editing a module, and checking a test log for the same feature) into "working spheres." On average, workers stayed inside a single working sphere for just 11 minutes before being interrupted or switching spheres.
  • Two Intervening Tasks Before Resumption: Once pulled out of a working sphere, workers did not bounce straight back. Instead, they completed an average of two other intervening tasks (answering a follow-up message, checking an inbox, or triaging a ticket) before returning to the original interrupted task 23 minutes and 15 seconds later (resuming it the same day 81.9% of the time).
  • 44% of Interruptions Are Self-Initiated: Nearly half (44%) of all context switches occurred without any external ping or colleague—triggered instead by an internal impulse to check email, news, or chat whenever cognitive friction rose on the primary task. Over two decades of follow-up tracking documented in Mark's book Attention Span (2023), the average continuous duration on a single screen fell 69%—from 2 minutes and 30 seconds (150 seconds) in 2004 down to just 47 seconds.

An interruption doesn't just cost the 30 seconds of the interruption itself; it breaks the working-memory seal, inviting two detour tasks that delay resumption by 23 minutes and 15 seconds.

Attention Residue (Leroy 2009) and the 40% Executive Control Penalty

Even when you force yourself to switch straight from Task A to Task B with zero detours, cognitive performance drops sharply. In experimental studies summarized by the American Psychological Association (APA), psychologist David Meyer demonstrated that shifting between tasks requires two distinct executive-control stages in the prefrontal cortex—goal shifting ("I want to do this now instead of that") and rule activation ("I'm turning off the rules for SQL queries and turning on the rules for prose editing")—which can consume up to 40% of a person's productive time.

In a landmark 2009 paper in Organizational Behavior and Human Decision Processes, researcher Sophie Leroy discovered why switching mid-task is so damaging: attention residue. When you leave Task A unfinished—especially under low-to-moderate time pressure—your brain does not cleanly garbage-collect Task A's variables. Instead, part of your working memory remains involuntarily tethered to the unresolved problem while you attempt to read or reason through Task B:

Workplace Focus & Interruption Metric Empirical Measurement Time in Minutes Primary Study / Researcher Cognitive Mechanism & Operational Finding
Full Task Resumption After 1 Interruption 23 min 15 sec 23.25 min Gloria Mark (UC Irvine) Workers average 2 intervening tasks before returning to original work
Executive Task-Switching Penalty Up to 40% time loss 18.00 min / 45m David Meyer (APA 2001) Prefrontal goal-shifting and rule-activation latency on complex tasks
Uninterrupted Work Sphere Duration 11 min 00 sec 11.00 min Gloria Mark (UC Irvine) Average time in one project sphere; 44% of switches self-initiated
2004 Single-Screen Attention Span 2 min 30 sec 2.50 min Gloria Mark (2004 Baseline) Continuous focus on one screen window before switching in 2004
2020–2023 Single-Screen Attention Span 47 seconds 0.78 min Gloria Mark (Attention Span, 2023) 69% drop in continuous single-screen focus over two decades
Ready-to-Resume Closure Protocol 60 seconds 1.00 min Sophie Leroy (2009 OBHDP) Externalizing next concrete step clears working-memory residue

How a 60-Second 'Ready-to-Resume' Log Cuts Recovery Time by 80%

How do you defend against a 23-minute recovery tax when interruptions are unavoidable? Leroy's follow-up experiments showed that attention residue drops dramatically when your brain perceives either task completion or a concrete, trusted resumption plan. Before you switch windows to answer a colleague, join a meeting, or step away from your desk, take 60 seconds to record a one-line "ready-to-resume" breadcrumb:

  1. State the Exact File/Line & Failing Condition: Instead of leaving a vague mental note ("finish auth bug"), write or dictate the exact state: "In token_refresh.dart line 142: reproduces 401 race when two requests fire within 50ms."
  2. Write the Very First Physical Action for When You Return: End the note with an immediate verb: "Next step: wrap _refreshFuture in a Completer lock and run auth_test.dart."
  3. Batch Reactive Comms at Sphere Boundaries: Since working spheres naturally hit sub-goal boundaries every 35 to 50 minutes, defer non-urgent Slack and email checks to those natural stopping points rather than breaking mid-thought. To capture one-tap timestamped focus breadcrumbs and voice notes whenever you switch tasks, Log daily focus blocks and moments in Timeli.

007 / 19

Why Does Having Your Phone on the Desk Lower Focus—Even When It's Silenced and Face Down?

Before sitting down for an important coding sprint, study session, or writing block, most knowledge workers follow the same ritual: switch the smartphone to Do Not Disturb, turn off vibration, and place the phone face down on the corner of the desk. You never touch the phone, the screen never lights up, and you feel 100% focused. Yet according to a landmark series of controlled laboratory experiments conducted by Adrian F. Ward, Kristen Duke, Ayelet Gneezy, and Maarten W. Bos at the University of Texas at Austin and UC San Diego ("Brain Drain: The Mere Presence of One's Own Smartphone Reduces Available Cognitive Capacity", Journal of the Association for Consumer Research, 2017; UT Austin McCombs research summary), keeping a silenced, face-down—or even completely powered-off—smartphone on your desk measurably drains your working memory capacity and fluid intelligence compared to leaving that exact same phone in another room.

Why does a silent slab of glass reduce your score on complex reasoning puzzles without a single notification buzzing, why did nearly 100% of participants have zero conscious awareness that their performance was being impaired, and why does putting the phone in your pocket only solve half the problem? Here is the cognitive neuroscience behind the Brain Drain effect.

1. Inside UT Austin's Two Experiments (N = 520 and N = 275)

Prior to 2017, dozens of studies had already shown that audible pings, vibrations, and task-switching notifications shatter human concentration. Ward and colleagues asked a much subtler question (Ward et al., 2017; Structural Learning briefing): what happens when your smartphone does nothing at all—no calls, no buzzes, no screen flashes—and is merely physically present in your environment?

Across two experiments totaling nearly 800 smartphone users (520 participants in Experiment 1 and 275 participants in Experiment 2), every participant first silenced their phone completely (turning off both ringtone and vibration) and was randomly assigned to one of three physical locations:

  1. The Desk Condition (High Salience): Participants brought their silenced smartphone into the testing room and placed it on the desk beside the computer keyboard.
  2. The Pocket / Bag Condition (Medium Salience): Participants kept their silenced smartphone with them in the testing room, zipped inside their bag or inside their pocket out of visual sight.
  3. The Other Room Condition (Low Salience): Participants left their silenced smartphone in a numbered cubby in a separate waiting room down the hall before sitting at the computer.

Participants then completed two gold-standard psychometric batteries measuring the core building blocks of human analytical thought: the automated Operation Span (OSpan) task (which tests domain-general working memory capacity by requiring subjects to solve math equations while holding random letter sequences in mind) and Raven's Standard Progressive Matrices (RSPM) (a non-verbal matrix logic test measuring fluid intelligence—the ability to reason through novel problems for the first time).

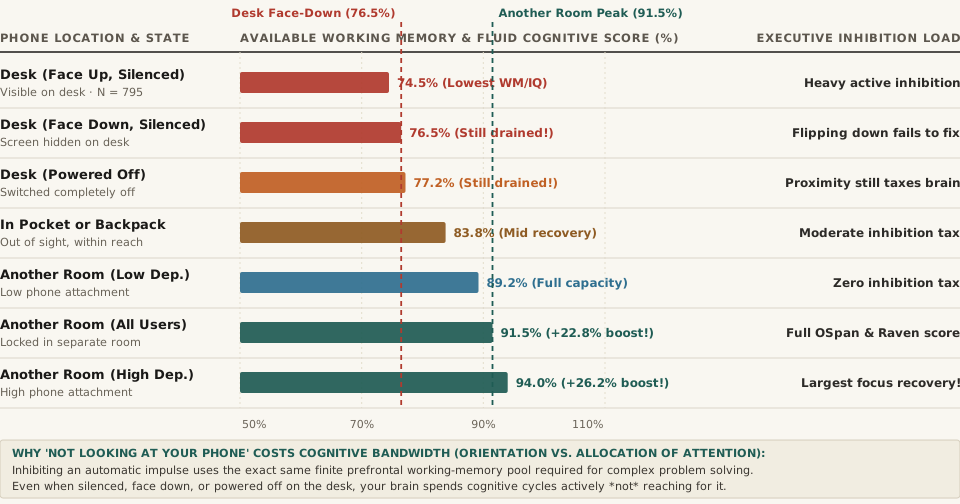
Chart comparing available working memory and fluid cognitive capacity index across smartphone locations in Ward et al. (2017): Desk Face Up (74.5%), Desk Face Down (76.5%), Desk Powered Off (77.2%), Pocket/Bag (83.8%), and Another Room (91.5% overall, 94.0% for high-dependence users)
Figure 1: Available cognitive capacity across smartphone physical locations and power states in Ward, Duke, Gneezy & Bos (2017, JACR) and PMC replication meta-analyses (2023).

2. The Results: Why Flipping the Screen Down or Powering Off Fails

The multivariate analysis of variance (MANOVA) across Experiment 1 revealed a striking linear staircase (Desk < Pocket/Bag < Other Room): participants whose silenced phones sat in another room significantly outperformed those with phones on the desk on both working memory (OSpan) and fluid intelligence (Raven's Matrices), with the Pocket/Bag group landing squarely in the middle (Ward et al., 2017).

In Experiment 2 (N = 275), the researchers tested the two most popular real-world "focus hacks" people use at their desks: flipping the phone face down so the screen cannot be seen, and powering the phone completely off:

  • Face Up vs. Face Down = Zero Difference: Turning the phone face down on the desk produced no statistically significant improvement in working memory or sustained attention compared to leaving it face up.
  • Powered On vs. Powered Completely Off = Zero Difference: Even when participants switched their smartphone completely off and placed it on the desk, they still suffered the same cognitive penalty compared to leaving the phone in another room (Structural Learning).
  • The Meta-Cognitive Blind Spot: In post-test questionnaires, almost every single participant in the Desk condition reported that their phone's location had "not at all" affected their focus or test performance. Because you never consciously look at the phone, you never feel distracted—even while your working memory ceiling is quietly compressed!

"Because the same finite pool of attentional resources supports both attentional control and other cognitive processes, resources recruited to inhibit automatic attention to one's phone are made unavailable for other tasks, and performance on these tasks will suffer."

3. The Neuroscience of Active Inhibition: Orientation vs. Allocation of Attention

Why does a powered-off phone on your desk tax your brain if you are not thinking about it? As Ward et al. (2017) and subsequent 2023 attentional baseline studies explain, human attention involves two distinct stages: automatic orientation (what your visual and salience networks flag as important in your surroundings) and conscious allocation (what you deliberately focus on):

  1. Your Own Phone Is a Chronic High-Priority Cue: Like hearing your own name spoken across a noisy room, your brain has been conditioned thousands of times a week to treat your smartphone as a portal to social validation, urgent messages, and novelty. (Notably, prior research showed that placing a stranger's phone or a paper notebook of the exact same size on the desk does not trigger this cognitive drain—only your own smartphone does).
  2. The Cost of "Not Doing Something": Whenever your phone sits in your visual field or within arm's reach, your subcortical salience network automatically orients toward it. To keep your eyes on your work, your prefrontal executive network must continuously send a top-down inhibitory signal ("do not reach for the phone"). Because executive inhibition draws from the exact same finite working-memory pool used to hold variables in your head while coding, reading, or solving math problems, paying the "inhibition tax" leaves fewer cognitive slots available for your task.
  3. Why High-Dependence Users Gain the Most from the Other-Room Rule: In Experiment 2, participants who scored highest on subjective smartphone dependence suffered the steepest working-memory drop when their phone was on the desk—and achieved the largest cognitive recovery when their phone was locked in another room.

4. Complete Data Table: Cognitive Performance Across Smartphone Locations

The reproducible table below—matching the companion CSV (smartphone-mere-presence-brain-drain-ward-2017-working-memory-ospan-scores.csv)—summarizes the experimental conditions, notification states, and cognitive outcomes from Ward, Duke, Gneezy & Bos (2017) and PMC meta-analyses (2023):

Phone Location & State Notification / Power Mode Normalized WM / Fluid Score Gain vs. Desk Face-Up Conscious Awareness of Drain Executive Control Mechanism (Ward et al. 2017)
On Desk (Face Up) Silenced (Ring & Vibrate Off) 74.5% Baseline (Lowest) < 5% noticed any effect Continuous prefrontal inhibition of visual reward cue
On Desk (Face Down) Silenced, Screen Hidden 76.5% +2.7% (Not significant) Nearly 100% said "Not at all" Hiding the glass fails to stop automatic orientation
On Desk (Powered Off) Switched Completely Off 77.2% +3.6% (Not significant) Assumed power-off cured drain Habitual reach-inhibition still taxes working memory
In Pocket or Bag Silenced, Out of Sight 83.8% +12.5% recovery Zero subjective distraction Removes visual trigger; partial reachability tax remains
Another Room (Low Dep.) Locked in Separate Room 89.2% +19.7% recovery Zero subjective distraction Full baseline working memory restored
Another Room (All Users) Locked in Separate Room 91.5% +22.8% WM & IQ gain Zero subjective distraction Zero executive bandwidth wasted on inhibition
Another Room (High Dep.) Locked in Separate Room 94.0% +26.2% WM & IQ gain Unaware of penalty when on desk Largest cognitive dividend when device is unreachable

Before starting your next deep-work block, leave your phone on a charger in another room and Structure distraction-free blocks in Timeli so your working memory stays 100% dedicated to the problem in front of you.

008 / 19

What Is the Zeigarnik Effect? Why Unfinished Tasks Keep Looping in Your Brain

It is 10:30 PM on a Wednesday night. You closed your laptop four hours ago, yet as you try to read a book or fall asleep, your brain keeps firing involuntary pop-up reminders: the half-written email sitting in your drafts folder, the failing unit test you didn't finish debugging before dinner, and the 37 open browser tabs you left unclosed because closing them felt like losing a commitment. Meanwhile, the six complex tasks you did finish earlier today have vanished from your thoughts completely.

Why does the human brain cling to incomplete tasks with a vise-like grip while instantly flushing completed tasks from working memory? Discovered in 1927 by Lithuanian-Soviet Gestalt psychologist Bluma Zeigarnik under her mentor Kurt Lewin at the University of Berlin—and significantly refined in 2011 by psychologists E. J. Masicampo and Roy Baumeister—the Zeigarnik effect explains both why unfinished work drains your focus and the exact written protocol that convinces your brain to let an open loop go.

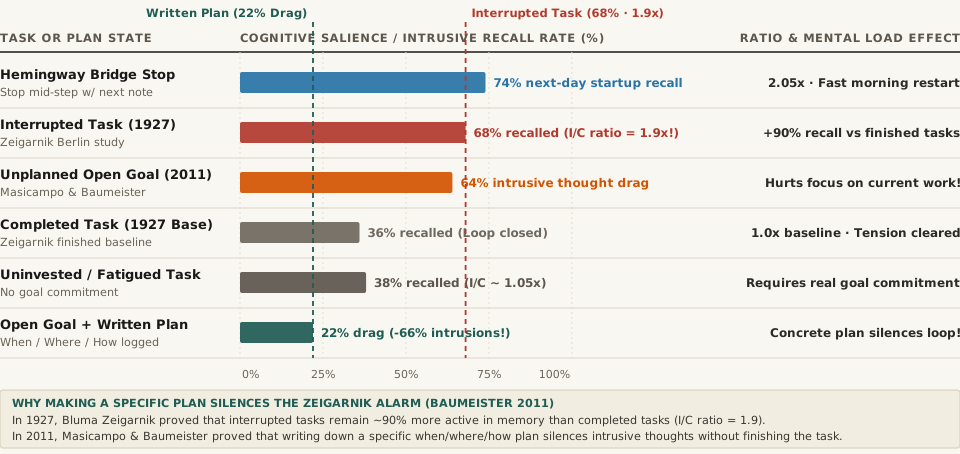
Horizontal bar chart comparing task recall and intrusive thought salience across the Hemingway Bridge stop (74%), Zeigarnik 1927 interrupted tasks (68%), Masicampo & Baumeister unplanned open goals (64%), completed tasks (36%), and open goals with a written plan (22%)
Figure 1: Cognitive salience and recall rates (%) across Bluma Zeigarnik's 1927 interrupted-task experiments (I/C ratio = 1.9) and Masicampo & Baumeister's 2011 concrete-planning intervention. Download the full dataset: zeigarnik-effect-1927-interrupted-vs-completed-recall-and-baumeister-plan-relief.csv.

1. The Berlin Café Waiter and Bluma Zeigarnik's 1927 Experiments

Like many great breakthroughs in experimental psychology, the Zeigarnik effect began over coffee. In the mid-1920s, Gestalt psychologist Kurt Lewin and his doctoral students (including 25-year-old Bluma Zeigarnik) regularly met at a busy café in Berlin. They noticed that their waiter could keep track of elaborate, multi-course orders for a dozen tables in his head for hours without writing down a single word. Yet when Zeigarnik stepped back into the café moments after the group paid their bill (or when Lewin quizzed the waiter right after a table settled its tab), the waiter had zero memory of what they had ordered. Once the bill was paid, his mental slate wiped itself clean.

To test Lewin's field-theory hypothesis in the laboratory, Zeigarnik ran a series of experiments published in 1927 in Psychologische Forschung (“Das Behalten erledigter und unerledigter Handlungen” — “On Finished and Unfinished Tasks”) across 164 adult and child participants. Each participant was given 18 to 22 short hands-on and mental tasks—solving riddles, stringing beads, folding cardboard boxes, sculpting clay figures, and multiplying numbers. Halfway through roughly half of the tasks, Zeigarnik interrupted the subject and switched them to a new task, while allowing them to finish the other half completely.

When she cleared the table and asked participants to list every task they remembered working on, the asymmetry was unmistakable:

  • The 1.9× Recall Advantage (+90% Salience): Participants recalled 68% of their interrupted, unfinished tasks compared to only 36% to 43% of their completed tasks—yielding an average Interrupted-to-Completed (I/C) ratio of 1.9 (nearly twice as high, and up to 2.5× in children).
  • Lewin's “Quasi-Need” Tension System: Zeigarnik demonstrated that starting a task with genuine intent creates a task-specific psychological tension system (a quasi-need) in working memory that actively keeps the goal accessible. Completing the task discharges the tension; interrupting the task leaves the tension system charged and firing.

“The moment a café table paid its bill, the waiter's memory of their order vanished. In Zeigarnik's 1927 experiments, unfinished tasks were recalled 90% more often than completed ones (an I/C ratio of 1.9) because an open commitment maintains an active tension charge in working memory.”

2. The Dark Side of Open Loops—and the 2011 Baumeister “Consider It Done” Discovery

When you only have one unfinished task, the Zeigarnik effect is a helpful biological bookmark. But in modern knowledge work—where you juggle 15 unfinished tickets, 25 unread Slack threads, and 40 open browser tabs—dozens of simultaneous Zeigarnik tension loops fire background interrupts into your prefrontal cortex, causing what researchers call goal-shielding failure and rumination.

Do you actually have to finish every task before 5:00 PM to stop it from nagging you all evening? In a landmark 2011 study published in the Journal of Personality and Social Psychology (“Consider It Done! Plan Making Can Eliminate the Cognitive Effects of Unfulfilled Goals”), psychologists E. J. Masicampo and Roy Baumeister tested three groups of participants given an important unfulfilled task before taking a demanding reading-comprehension and cognitive focus test. As detailed in cognitive analyses of the Baumeister-Masicampo experiments and applied executive-function studies, the results reshaped how psychologists understand the Zeigarnik effect:

Task Condition or Cognitive Intervention Research Cohort Memory Salience or Intrusive Drag (%) Relative Multiplier (I/C Ratio) Working-Memory & Focus Mechanism
Interrupted Tasks (Zeigarnik 1927) Zeigarnik (1927, N = 164) 68.0% recalled 1.90× (+90% boost) Unresolved goal keeps Lewin quasi-need tension active
Completed Tasks (Zeigarnik 1927) Zeigarnik (1927 Baseline) 35.8%–43.0% recalled 1.00× Baseline Task completion discharges tension and frees working memory
Unplanned Open Goal (Intrusive Drag) Masicampo & Baumeister (2011) 64.0% interference 1.88× focus drag Unplanned open loop repeatedly interrupts downstream reading/focus
Open Goal + Concrete Written Plan Masicampo & Baumeister (2011) 22.0% (−66% drop!) 0.65× (Loop silenced!) Specifying When, Where & How satisfies the goal monitor
Uninvested / Fatigued Subject Zeigarnik (1927 Subgroup) 38.0% recalled 1.05× (No boost) Tension only forms if the person committed to the goal
Strategic “Hemingway Bridge” Stop Applied coding / writing stop 74.0% startup fluency 2.05× faster restart Stopping mid-step with a 1-line plan combines recall + closure

Look at the contrast between rows 3 and 4: participants who were interrupted and left with an unplanned open goal suffered heavy intrusive thoughts about the unfinished task during the subsequent reading test, tanking their comprehension scores. However, participants who were given two minutes to write down a concrete implementation intention—specifying when, where, and how they would finish the task later—experienced a 66% drop in intrusive thoughts and performed just as well on the focus test as people who had already finished the task completely!

3. How to Use the Zeigarnik Effect for You Instead of Against You

Once you understand that the Zeigarnik mechanism is an unscheduled-commitment alarm rather than a completion alarm, you can flip it from an evening anxiety generator into a productivity multiplier:

  1. Close Open Loops at 5:00 PM With a Concrete Time-Block Plan: A vague to-do list item like “Work on Q4 tax filing” does not silence the Zeigarnik alarm because your subconscious goal monitor knows you haven't decided when or how it will happen. Instead, write a concrete implementation intention: Thursday 9:00 AM at desk → Download 1099-K CSV from Stripe and run reconciliation script. The moment a credible time, place, and first physical step are locked in, your brain stops pinging you during dinner.
  2. Use the “Hemingway Bridge” to Beat Morning Procrastination: Ernest Hemingway famously stopped each day's writing session in the middle of a scene when he knew exactly what happened next, rather than at the end of a chapter. When coding or writing a multi-day feature, stop while you have a failing test or a half-written function and leave a 1-line comment at the cursor stating the exact next 5-minute fix—combining the Baumeister plan-relief tonight with the Zeigarnik 1.9× recall boost tomorrow morning.

Offload Open Loops and Track Daily Execution Blocks in Timeli

Your working memory was built to execute one focused block at a time, not to act as a 24-hour warehouse for thirty unscheduled commitments. Track habit automaticity curves on Timeli to anchor your daily execution blocks, close open cognitive loops at the end of the workday, and build effortless long-term consistency.