YellowSquared  /  Field notes

Notes from the workshop

59 posts, newest first. Choose an app to narrow the feed.

049 / 59

How Shared Baby Names Shift Between Girls and Boys

In 1963, Ashley appeared for 108 girls and 128 boys in the national files. By 1990, its count was 45,561 girls and 239 boys. That is a substantial shift in the sex balance of one spelling. Similar histories appear for Leslie and Aubrey.

But it does not establish a universal threshold after which boys abandon a name, or prove that change can never reverse. Some shared names retain substantial use for boys. Others become more male in recent years. The counts need to be read alongside the percentages.
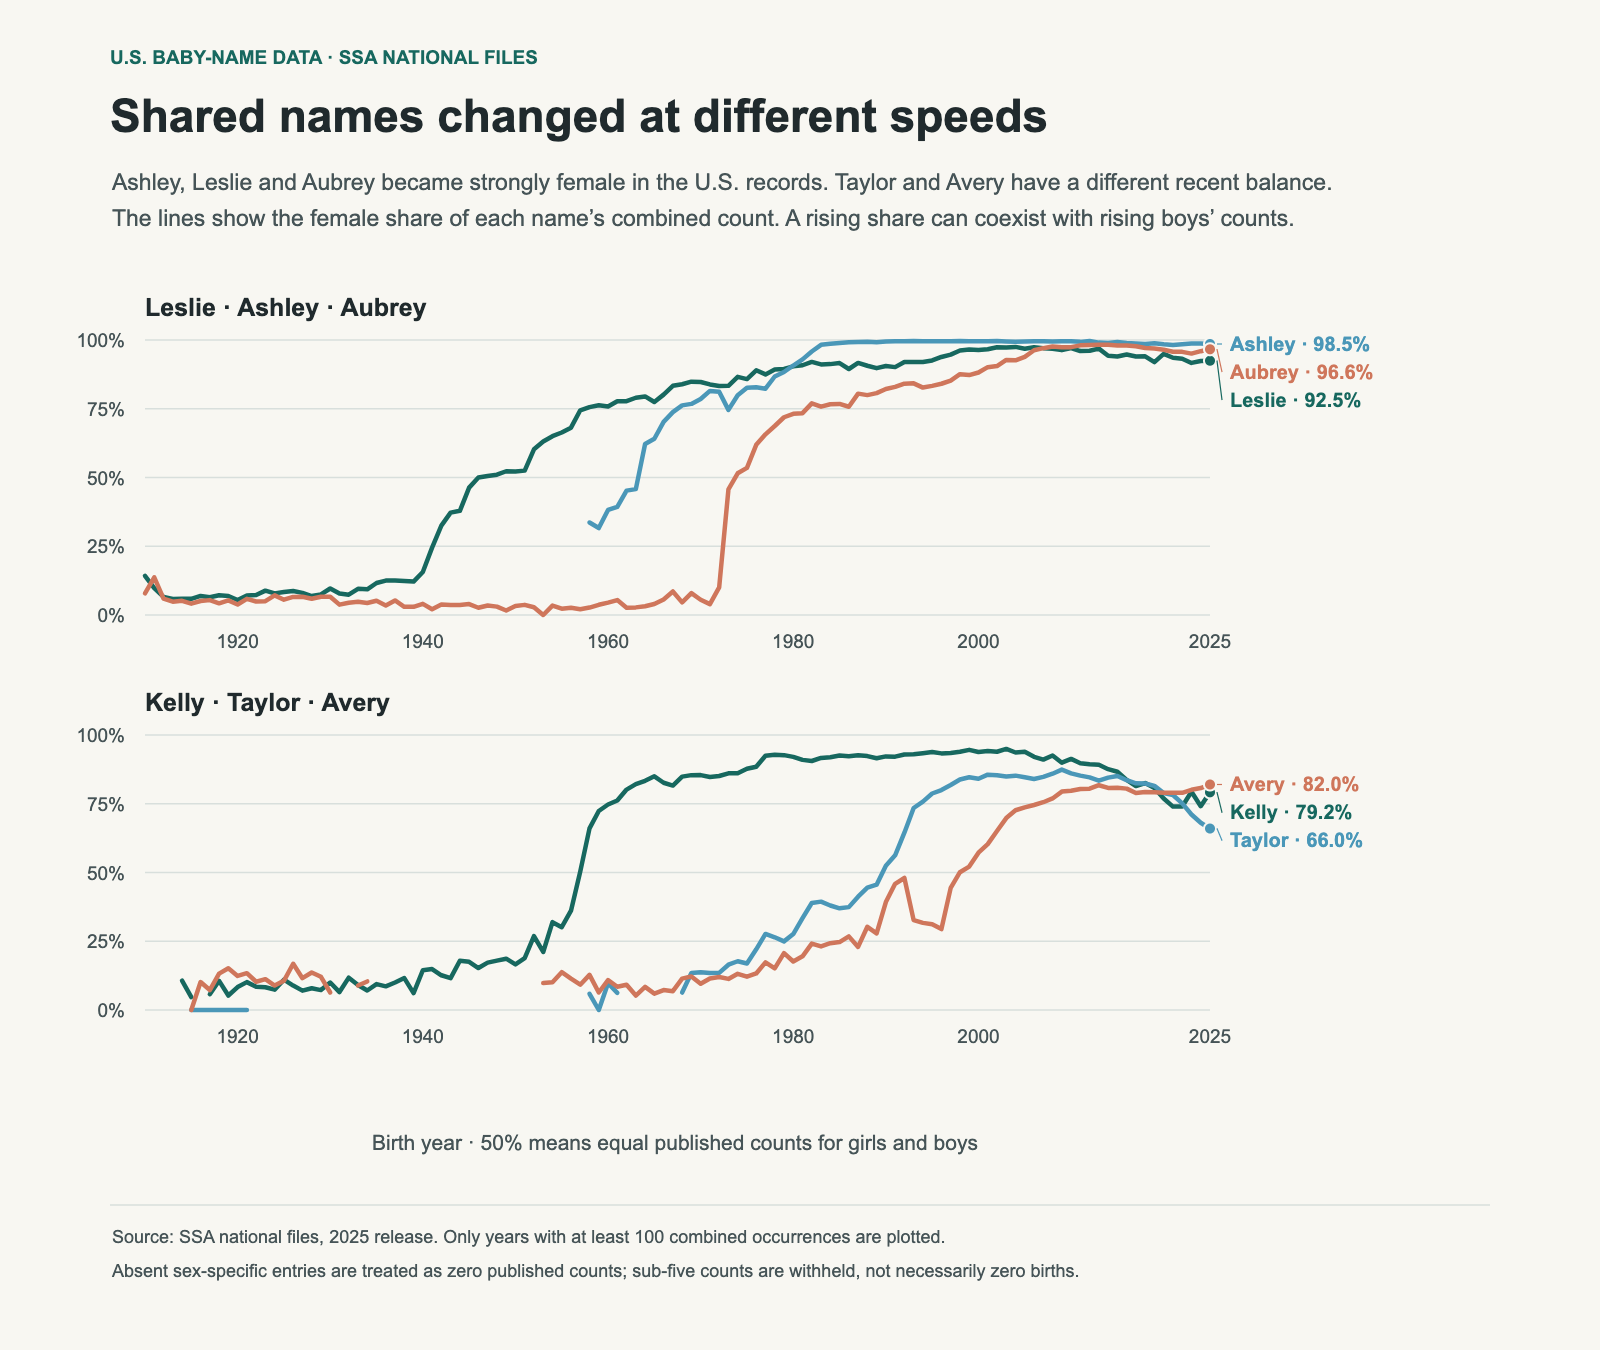
Two panels with three lines each show female shares for Leslie, Ashley, Aubrey, Kelly, Taylor and Avery from 1910–2025. Their recent balances differ.
A 75% point means that three of every four published occurrences of that spelling are in the female file. It does not mean 75% of girls received the name. The chart describes the SSA sex field, not the identity of people who bear a name.

The names changed at different speeds

Leslie and Kelly begin a sustained run of female-majority years in 1946 and 1957 respectively. Ashley does so in 1964, Aubrey in 1974, Taylor in 1990 and Avery in 1998. Here “sustained” means at least five consecutive years with female share at or above 50%, each with at least 100 combined published occurrences.

That rule makes the table of turning points less sensitive to a single small year. It remains a descriptive convention. The files do not identify a tipping point that all parents react to, and the names were selected for their histories.

Name1990 female share2025 female share2025 girls2025 boys
Leslie90.6%92.5%39332
Kelly92.2%79.2%31984
Ashley99.5%98.5%1,82927
Aubrey82.2%96.6%2,00370
Taylor52.5%66.0%772398
Avery39.2%82.0%5,2671,156

A share can fall while both counts rise

Rowan’s female share fell from 38.9% in 2010 to 19.2% in 2025. Over the same years, the girls’ count rose from 608 to 1,240 and the boys’ count rose from 955 to 5,212. Girls did not have to stop using Rowan for its male share to increase; boys’ use grew faster.

River moved differently. Its female share rose modestly, from 29.2% to 30.9%, while the boys’ count rose from 634 to 3,139. A rising female share did not require a collapse in boys’ use in that comparison.

Spelling2010 female share2025 female shareBoys’ count, 2010 → 2025
Rowan38.9%19.2%955 → 5,212
River29.2%30.9%634 → 3,139
Rory44.6%43.0%304 → 1,768
Remi75.4%86.2%65 → 323
Remy34.1%33.3%243 → 781

Small spelling differences can hide large differences in use

Remi and Remy should not be combined without saying so. In 2025, Remi was 86.2% female in the published counts, while Remy was 33.3% female. A single combined percentage would obscure two different balances that a family choosing an exact spelling may care about.

The SSA keeps spellings separate. That is useful here, but it also means a spelling’s U.S. balance cannot be assumed to describe its use in every language or country. A national file does not contain enough information to explain the reasons for a shift through migration, media or changing social expectations.

Recent years need not continue the earlier direction

Taylor’s female share was 86.1% in 2010 and 66.0% in 2025. It remained female-majority, but its balance moved away from the earlier high. Kelly’s female share also fell between those dates. Calling those names permanently locked to one sex would hide a change visible in the records.

There are also examples that moved in the other direction from a small female base: Kyrie was 83.7% female in 2010 and 4.9% female in 2025. That does not make it a representative case for all names, but it is enough to reject an absolute claim that no spelling ever shifts toward male use.

Use these figures as history, not a deadline

A current percentage can help describe how a name is used in these U.S. records. It cannot predict that a child’s classmates will regard it a particular way in 2035, or supply a reason to avoid a name that your family likes. Local use, language and personal associations differ.

For a shortlist, compare the exact spelling, the two counts and several recent years. Then discuss whether the balance matters to you. See how to compare favourites with a partner and how to read the wider trend.

Data and method

These calculations use the SSA’s pinned 2025 national release. “Published counts” means the sum of the name counts available for that year and sex. Names with fewer than five occurrences are withheld, so this denominator is not a complete count of all births. Historical records before 1937 are also incomplete. Female share is F ÷ (F + M) for an exact spelling. Lines omit years with fewer than 100 combined occurrences. An absent sex-specific entry contributes zero published counts, although a suppressed count may be between zero and four.

Download the chart data (CSV). The SSA download page provides the original files, and its background notes describe coverage and spelling conventions.
050 / 59

The X-Name Boom Peaked in 2018. What Changed?

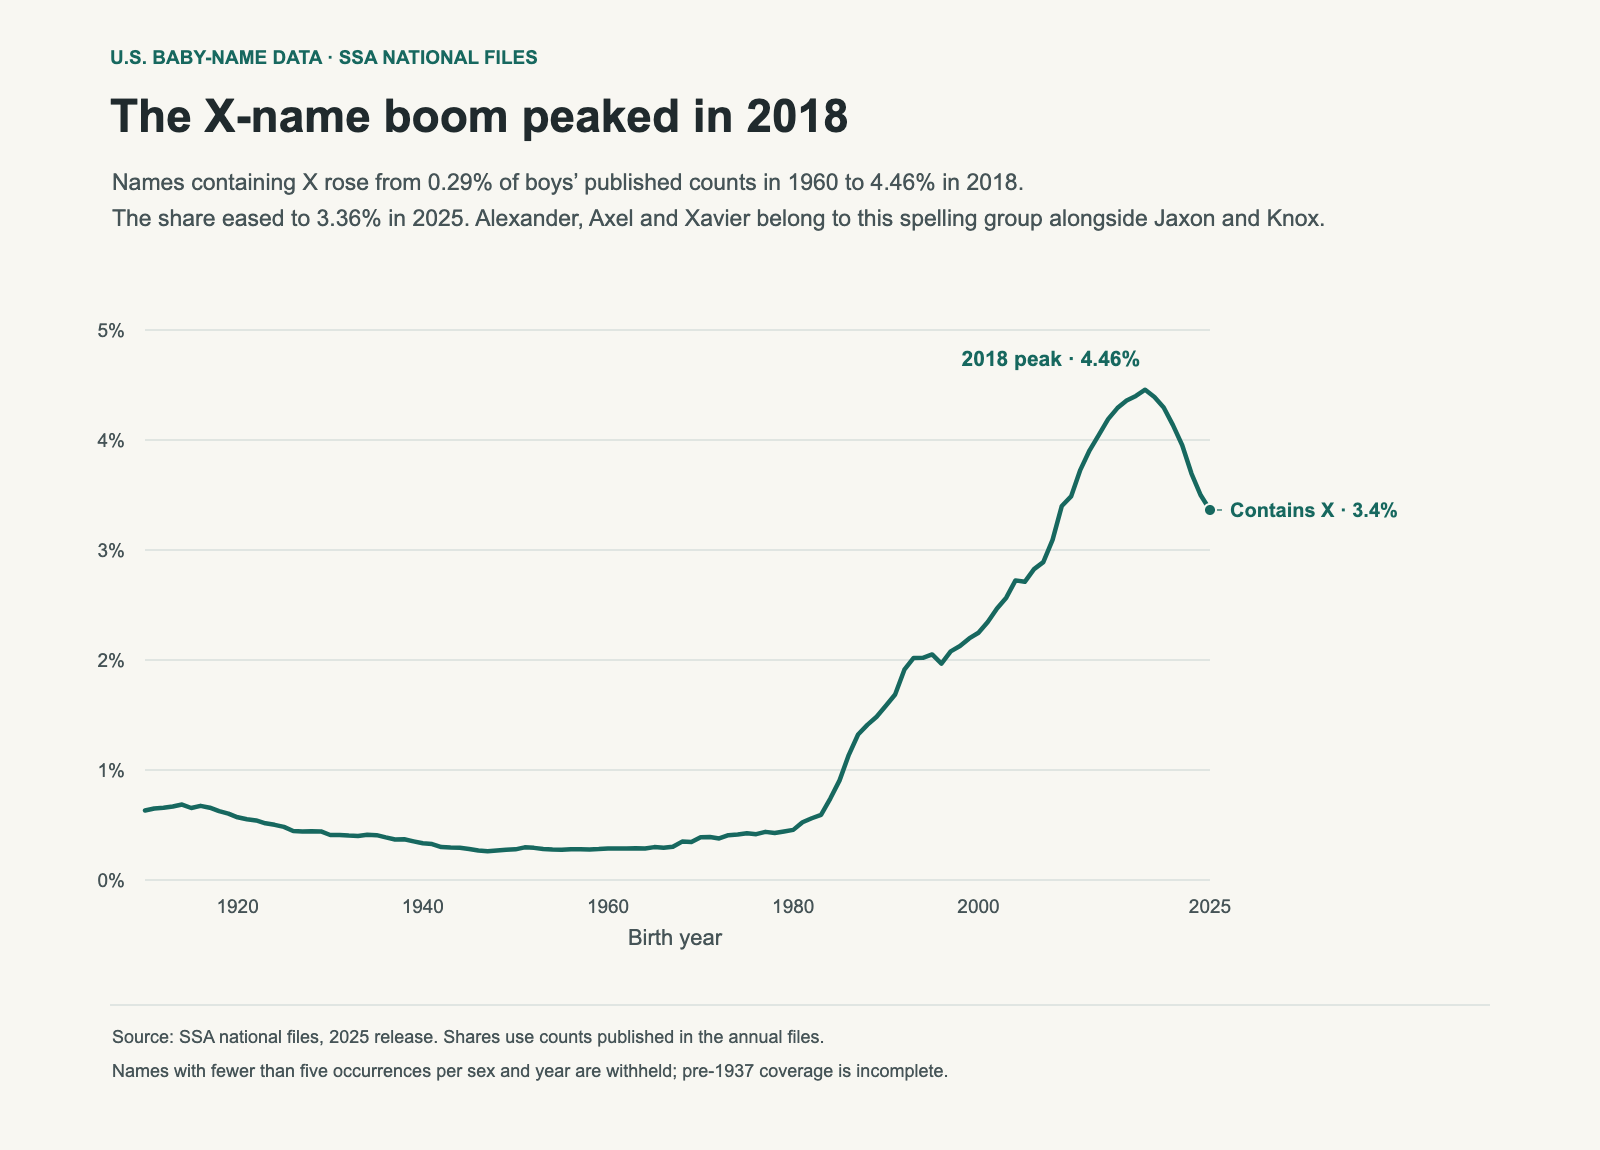
Names containing X grew from a small part of boys’ recorded names to a group representing about one in twenty-two published counts at its 2018 peak. In 1960 the share was 0.29%. By 2018 it was 4.46%, before easing to 3.36% in 2025.

Jaxon, Jaxson, Axel and Knox are easy examples to notice. But the group also includes Alexander, Alex, Max, Felix and Xavier. The X trend is a mixture of name histories, rather than a single new style arriving all at once.

Annual share of boys’ published name counts containing X rises to 4.46% in 2018 and declines to 3.36% in 2025.
About three of every 1,000 boys in the 1960 published counts had an X in their name. At the 2018 peak it was about 45 per 1,000; in 2025 it was about 34. X anywhere in the spelling counts, regardless of pronunciation.

The rise began before the most visible new spellings

The 1960 share was small, but the group was not absent. The files record 6,124 boys with an X-containing name that year. Rex, Alex and Alexander each accounted for more than 1,000 of them. Max and Felix were also established contributors.

By 1985 the share had already reached 0.91%, with Alexander accounting for 8,295 boys and Alex for 3,909. A story that treats the whole period before the 1990s as flat would overlook that growth. Later names added to a group that was already expanding.

YearPublished X-name countShare of boys’ count
19606,1240.29%
198516,7360.91%
199032,5271.58%
200044,1452.25%
201066,9053.49%
201880,9514.46%
202557,4563.36%

A shared letter can hide different trends

Alexander is the largest individual X-containing boys’ name in 2025, with 7,230 published occurrences. Axel follows with 4,140, then Xavier with 3,232 and Jaxon with 3,073. These names need not have the same origin, sound or cultural association to contribute to the same line.

The table compares the same spellings across two years. “Not published” means no entry appears in that year’s file; it does not prove there were zero births, because small counts are suppressed.

Spelling1960 boys2025 boys
Alexander1,1997,230
Rex1,314281
Alex1,2301,515
Max6692,025
Felix6552,064
Xavier1263,232
Axel134,140
JaxonNot published3,073
JaxsonNot published2,365
KnoxNot published1,836

Cooling off does not mean returning to the old baseline

The X share fell by 1.09 percentage points between its 2018 maximum and 2025. That is a decline of about a quarter relative to the peak share. It still remains more than eleven times the 1960 share.

Counts and shares answer different questions. A count tells us how many occurrences are published; a share adjusts for the size of that year’s published boys’ total. The chart uses the share so a change in the overall cohort does not, by itself, look like a change in preference for the group.

What would explain the rise?

Names can be influenced by family traditions, public figures, media and spelling preferences. This series does not measure those influences. The fact that a television programme or celebrity name appears near a turning point cannot establish that it caused the group’s growth.

To test a specific explanation, we would need to isolate the names concerned, compare their timing with an event, and examine competing explanations. The aggregate X line is a useful starting point for that work, but it does not identify one cultural cause.

For a shortlist, compare the individual name as well as the letter group. A name can be falling while its group is rising, and vice versa. See the guide to ranks, counts and decades, or compare changes in final letters.

Data and method

These calculations use the SSA’s pinned 2025 national release. “Published counts” means the sum of the name counts available for that year and sex. Names with fewer than five occurrences are withheld, so this denominator is not a complete count of all births. Historical records before 1937 are also incomplete. Names are selected if the stored spelling contains X, case-insensitively. All their published male counts contribute, including spellings outside the top 100. No pronunciation filter is applied.

Download the chart data (CSV). The SSA download page provides the original files, and its background notes describe coverage and spelling conventions.
051 / 59

The Top Ten Baby Names Cover Far Fewer Babies Now, 1910–2025

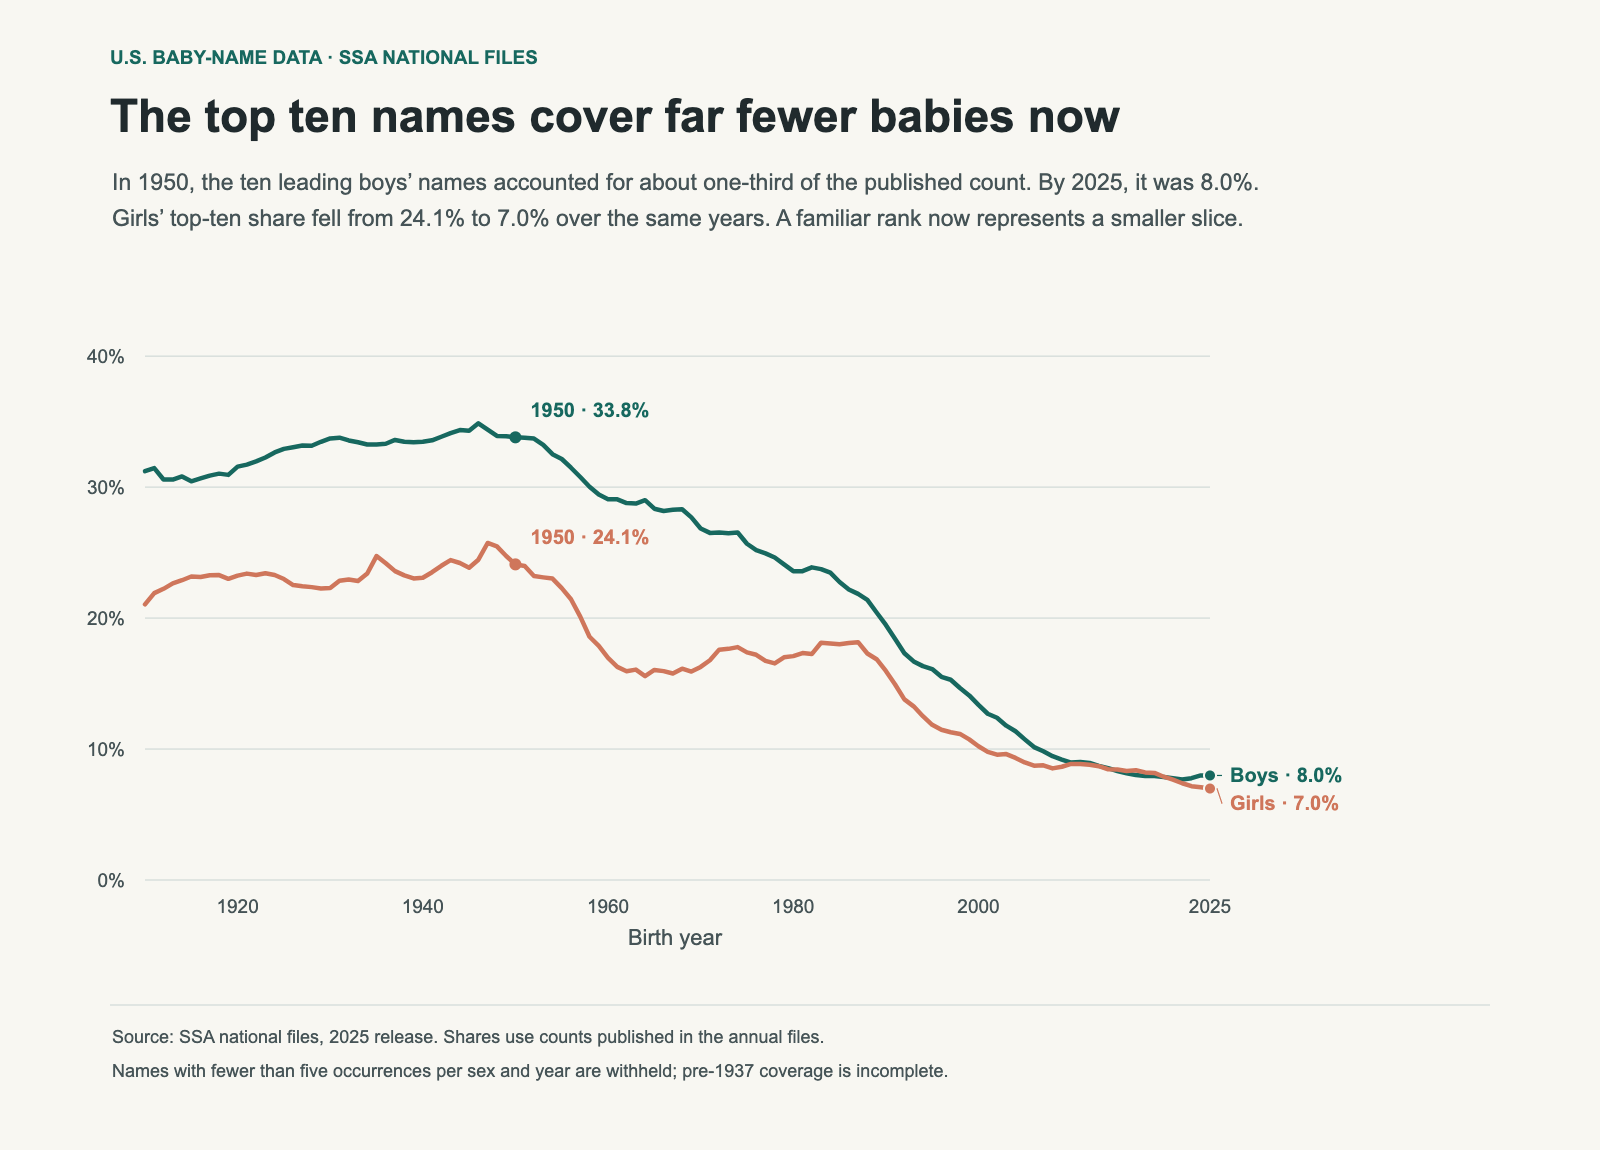
In 1950, about one in three boys represented in the national name files received one of the ten leading names. In 2025, the top ten accounted for about one in thirteen. James was the leading boys’ name in 1950, with 86,228 recorded occurrences. Liam led in 2025 with 20,818. Both names ranked first, but that position represented a very different share of the year’s names.

The change extends beyond the leading name. Girls’ top-ten share fell from 24.1% to 7.0% over the same years. Popular names still exist; they occupy less of the total. That helps explain why a name can be nationally prominent without appearing in every classroom.

Two annual lines show boys’ and girls’ top-ten shares declining between 1910 and 2025. The 2025 shares are 8.0% and 7.0%.
Imagine 100 boys drawn from the published counts. About 34 would have a top-ten name in 1950; about eight would in 2025. These are shares of counts, so a name used for 20,000 babies contributes more than one used for 2,000.

The same rank now covers a smaller slice

Rank records order. It does not preserve the distance between names, or the share represented by that position. James’s 1950 count was 4.82% of the published boys’ total. Liam’s 2025 count was 1.22%. For girls, Linda’s 1950 share was 4.70%; Olivia’s 2025 share was 0.84%.

A number-one name therefore need not be as concentrated as a number-one name remembered from an older generation. Comparing the label alone can make current popularity seem larger than it is. The count and share provide the scale that the rank leaves out.

YearBoys’ top 10Girls’ top 10Leading boy: shareLeading girl: share
193033.7%22.3%Robert · 5.66%Mary · 5.70%
195033.8%24.1%James · 4.82%Linda · 4.70%
197026.8%16.3%Michael · 4.59%Jennifer · 2.64%
199019.5%16.0%Michael · 3.18%Jessica · 2.45%
20109.0%8.9%Jacob · 1.15%Isabella · 1.29%
20258.0%7.0%Liam · 1.22%Olivia · 0.84%

The girls’ and boys’ paths were different

In 1970, the boys’ top ten represented 26.8% of published counts, while the girls’ top ten represented 16.3%. The gap was much smaller by 2010: 9.0% for boys and 8.9% for girls. By 2025 both were below 8%, with boys still slightly higher.

Boys’ leading names were more concentrated during much of the earlier record. The counts do not tell us that every family followed the same preference, or establish why the two series changed. Explaining a role for family traditions, media or naming websites would require evidence beyond these annual counts.

What is happening outside the top ten?

When the top-ten share falls, the remaining names collectively gain share. That does not mean every less-common name rises, or that the number of possible names grows at the same rate. Some names outside the top ten can decline while others gain. This chart measures concentration at one cutoff; it does not describe the full distribution.

Spelling also matters. The SSA lists different spellings separately. A sound shared by several spellings may be more common than any single spelling’s rank suggests. The top ten here consists of ten exact name entries, rather than ten combined name families.

What this means for a shortlist

Use the national share to understand scale, then check the state and years that matter to your family. A low national share cannot guarantee that a name will be rare in a particular school or neighbourhood. Local concentration, cohort size and related spellings all change that experience.

Popularity also is not a reason to reject a name you like. This comparison gives you a more precise question: how much of today’s cohort does it represent? For a close contest between two names, see what the Olivia–Charlotte gap reveals. For the shape of a name’s history, read how to compare decades.

Data and method

These calculations use the SSA’s pinned 2025 national release. “Published counts” means the sum of the name counts available for that year and sex. Names with fewer than five occurrences are withheld, so this denominator is not a complete count of all births. Historical records before 1937 are also incomplete. The ten largest counts are selected separately for each sex and year and divided by that year’s published total. A count tie is ordered alphabetically, with exactly ten entries selected.

Download the chart data (CSV). The SSA download page provides the original files, and its background notes describe coverage and spelling conventions.
052 / 59

How the Final Letters of Boys’ Names Changed, 1910–2025

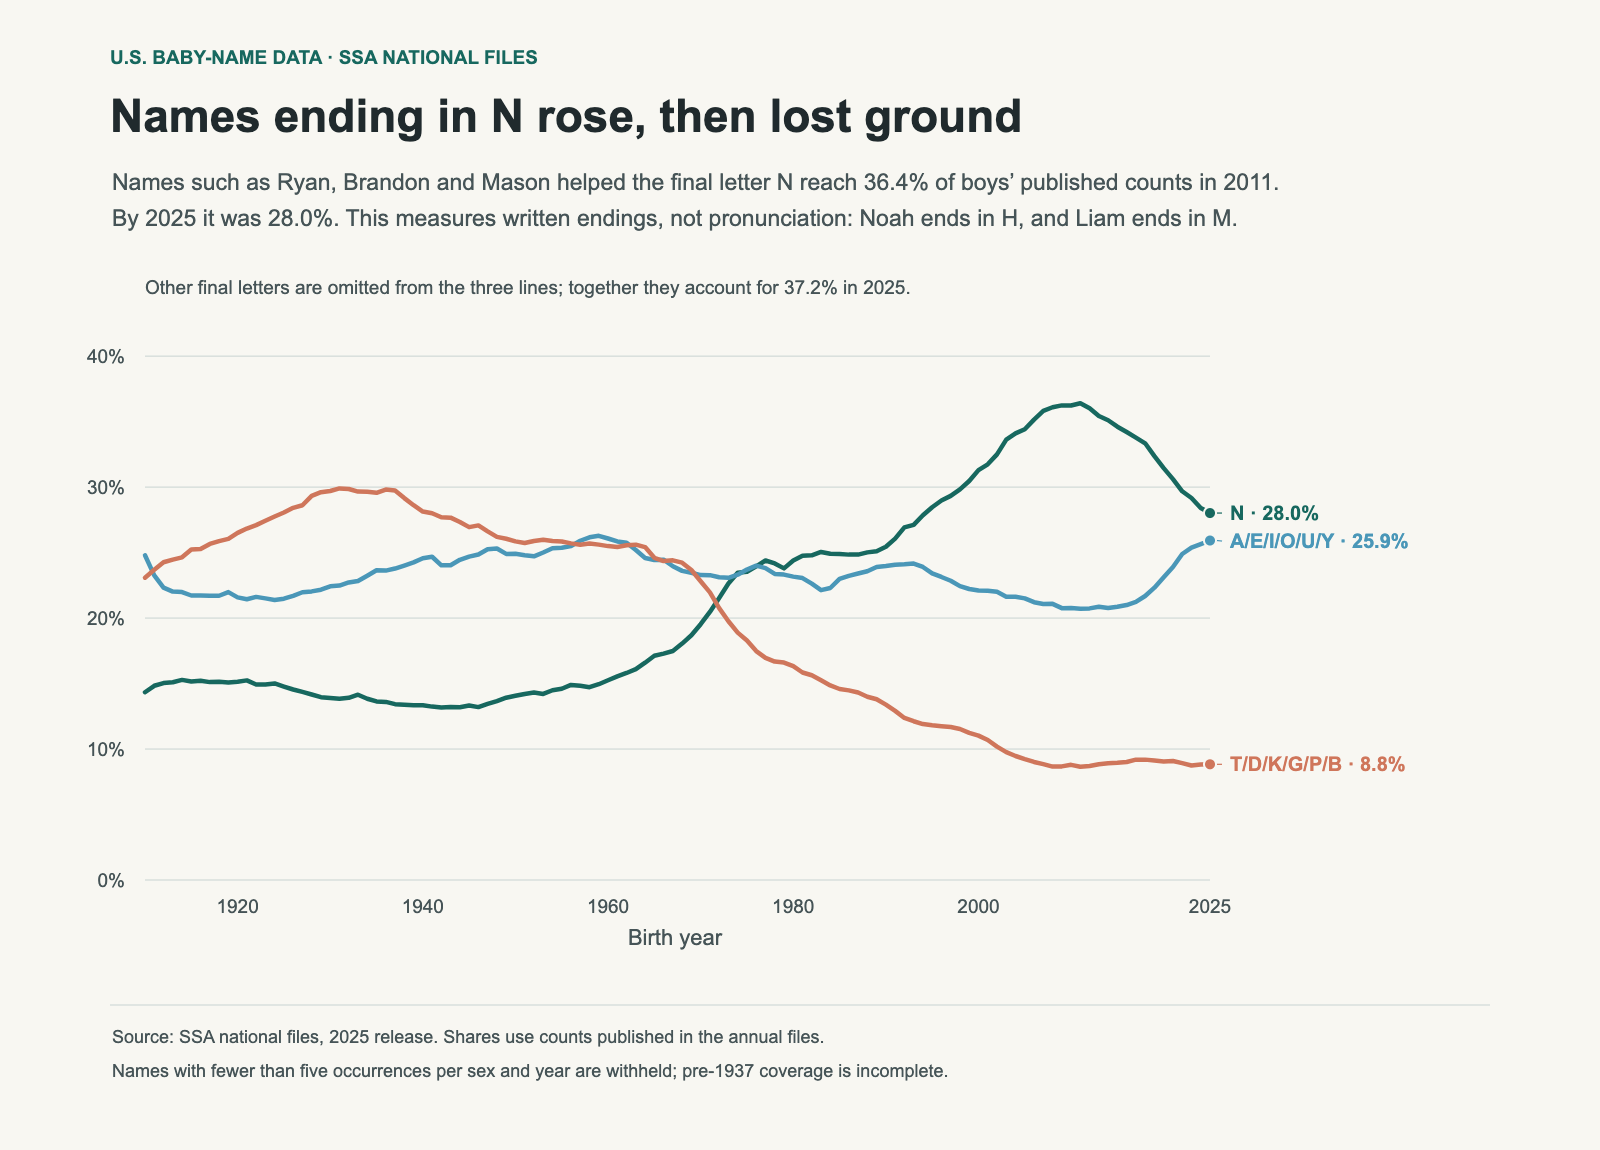
Names ending in N grew to more than one-third of boys’ published counts before losing some of that share. Ryan, Brandon, Justin, Aiden, Logan and Mason belong to that group. Its annual share reached 36.4% in 2011 and fell to 28.0% in 2025.

Another group moved in the opposite long-term direction: names ending in T, D, K, G, P or B fell from 29.7% in 1930 to 8.8% in 2025. Robert, Richard and Jack illustrate those written endings. These figures describe spelling. They do not measure how names sound.

Three annual lines compare boys’ names ending in N, A/E/I/O/U/Y, and T/D/K/G/P/B. N peaks in 2011 and recedes.
A baby named Mason contributes to the N line; Luca contributes to A/E/I/O/U/Y. Noah ends in H and Liam in M, so both fall outside these three lines. The shares count babies represented in the files, not the number of distinct names.

The N wave has a rise and a decline

The N group accounted for 13.9% of the published boys’ total in 1930 and 25.4% in 1990. It reached 36.2% in 2010, just before its 2011 maximum. Looking only at those dates would suggest a continuing climb. The latest years show why the endpoint matters: by 2025 the share was 28.0%.

A falling group share does not require every name in it to fall. Mason and Logan can remain familiar while other names enter the list or gain share. Grouping names by a letter reveals a broad pattern, while the individual histories explain which names contribute to it.

YearFinal NFinal A/E/I/O/U/YFinal T/D/K/G/P/B
193013.9%22.4%29.7%
195014.1%24.9%25.9%
197019.5%23.3%22.8%
199025.4%24.0%13.4%
201036.2%20.8%8.8%
202528.0%25.9%8.8%

The other letters are a large part of the story

The three plotted groups account for 62.8% of the 2025 published boys’ total. The remaining 37.2% ends in other letters, including H, M, R, L and S. Omitting that remainder from a line chart makes comparisons easier to read, but it must not be mistaken for a complete breakdown.

This is particularly relevant to current names. Noah ends in H; Liam ends in M; Oliver ends in R. A description of today’s names as simply “more vowel-ending” would miss all three. The A/E/I/O/U/Y group’s share rose from 20.8% in 2010 to 25.9% in 2025, but it remains only one part of the mix.

Why spelling is not a sound classification

The last letter can be silent, can form part of a larger spelling pattern, or can be pronounced differently across languages. A final E does not necessarily indicate an audible vowel ending. A final N tells us the written form, rather than the name’s full pronunciation or rhythm. Grouping Y with vowel letters is also a calculation convention, not a linguistic conclusion.

To study sound, we would need pronunciation data, rules for variants and a clear treatment of names used in more than one language. The SSA files supply spellings and counts. They support the chart shown here without those additional assumptions.

A useful way to compare favourite names

Read the spelling trend beside the names themselves, then say your shortlist aloud with the intended surname. Names that share a final letter can have very different syllable counts and rhythms. The chart can explain why a written pattern looks familiar; it cannot decide how your child’s full name will sound.

For a separate spelling measure, see the changing lengths of girls’ and boys’ top-100 names. The X-name analysis shows why a letter inside a name can also hide a varied group.

Data and method

These calculations use the SSA’s pinned 2025 national release. “Published counts” means the sum of the name counts available for that year and sex. Names with fewer than five occurrences are withheld, so this denominator is not a complete count of all births. Historical records before 1937 are also incomplete. Each boys’ name is assigned by its final stored letter, case-insensitively. Counts are summed within each group before division by the published boys’ total. Other final letters are retained in the denominator.

Download the chart data (CSV). The SSA download page provides the original files, and its background notes describe coverage and spelling conventions.
053 / 59

Old Baby Names Can Return - Without a Universal 100-Year Clock

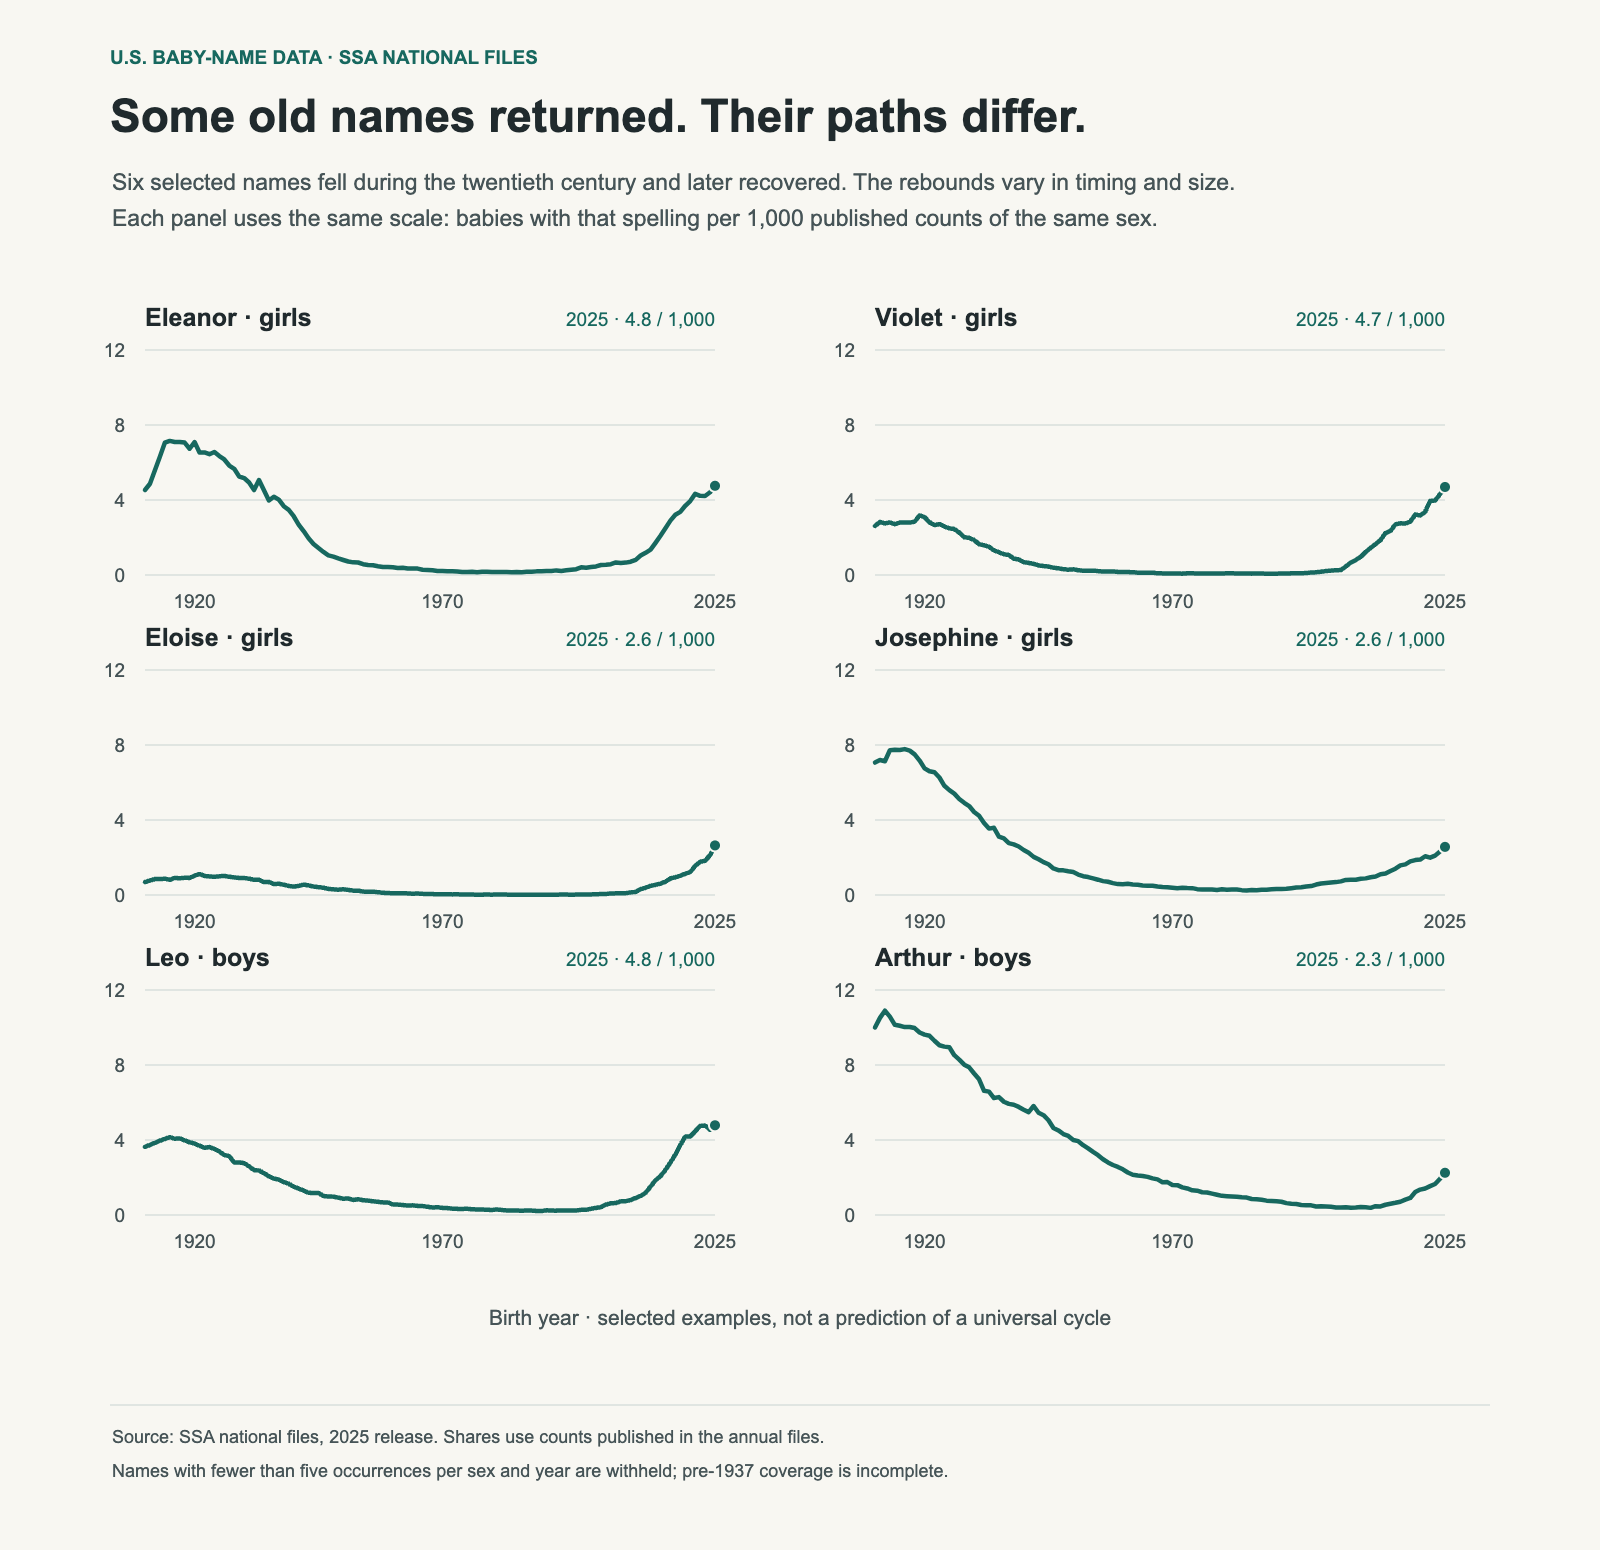
Violet appeared 113 times in the girls’ file for 1975. In 2025 it appeared 7,546 times and ranked thirteenth. Eloise rose from 38 recorded girls in 1975 to 4,251 in 2025. Names that once occupied a small corner of the list have become familiar again.

That revival is often described as a hundred-year naming cycle. The examples do show long declines followed by recoveries. They do not establish a clock that applies to every name, or tell us which currently uncommon names will return next.

Six panels show sex-specific annual shares per 1,000 published counts for Eleanor, Violet, Eloise, Josephine, Leo and Arthur, with a common scale.
A value of five means five recorded babies with that spelling per 1,000 published counts of the same sex. All six panels use the same scale. These are selected comeback examples, not a representative sample of every old name.

The recoveries differ in size

Violet and Leo have surpassed their 1920 counts. Eleanor’s 2025 count is still below its 1920 count, while Arthur has recovered only part of its earlier level. Josephine and Eloise provide two more distinct paths. Combining them into a single “vintage names are back” claim hides those differences.

Name1920 count1975 count2025 count2025 rank
Eleanor8,4972347,649#12
Violet3,6941137,546#13
Eloise1,239384,251#49
Josephine8,0934564,126#53
Leo4,0545168,173#19
Arthur10,2362,0223,847#87

The 1975 column is a fixed comparison year, not a claim that every name hit its minimum then. In the 1950–2000 window, Violet’s smallest count is in 1972, Eleanor’s in 1974, Eloise’s in 1977, Leo’s in 1986, Josephine’s in 1985 and Arthur’s in 1999. Their low points were spread over decades.

Count recovery is not the same as share recovery

The total number of published names changes between years, so counts alone can mislead. Eleanor’s 8,497 girls in 1920 represented about 7.1 per 1,000 published female counts. Its 7,649 girls in 2025 represented about 4.8 per 1,000. Its count has approached the earlier level more closely than its share has.

The chart therefore uses shares within each year and sex. It also keeps a common scale rather than giving every name’s highest point a value of 100%. That lets you see both the shape of the revival and the size of each name’s presence.

Why a huge percentage increase can sound larger than it is

Eloise’s count is about 112 times its 1975 count. That is a large recovery, but it begins from just 38 occurrences. Its 2025 share remains about 2.6 per 1,000 published girls’ counts. A dramatic growth percentage and a modest population share can both be true.

For parents, the current count or share is usually more useful than a trough-to-now percentage. It tells you how common the name is now, rather than how far it has travelled from an unusually small starting point.

Why these curves cannot predict the next revival

These names were chosen because they show a recovery. That selection leaves out old names that stayed uncommon, declined further or followed a different path. A forecasting rule would have to include those cases, define what counts as a revival, and be checked against names that were not used to build the rule.

Generational associations are one possible explanation for a name feeling dated at one time and appealing later. The SSA files do not record parents’ reasons, so the explanation should remain a hypothesis here. The curves show use changing over time, rather than a survey of what each generation thought.

Use the history as context

A revived name can offer both a long history and a place in the current cohort. If that appeals to you, inspect its recent years, related spellings and local use. You do not need to prove that it is “due” for a comeback to choose it.

See how to read a decade chart, and compare how quickly different names fall from their peaks. Both help distinguish a historical pattern from a prediction.

Data and method

These calculations use the SSA’s pinned 2025 national release. “Published counts” means the sum of the name counts available for that year and sex. Names with fewer than five occurrences are withheld, so this denominator is not a complete count of all births. Historical records before 1937 are also incomplete. Each spelling is measured for the sex named in its panel. The chart divides its annual count by the published total for that sex and multiplies by 1,000. The six examples are deliberately selected and are not a random sample.

Download the chart data (CSV). The SSA download page provides the original files, and its background notes describe coverage and spelling conventions.
054 / 59

How Long Does a Baby Name Take to Fall Below Half Its Peak?

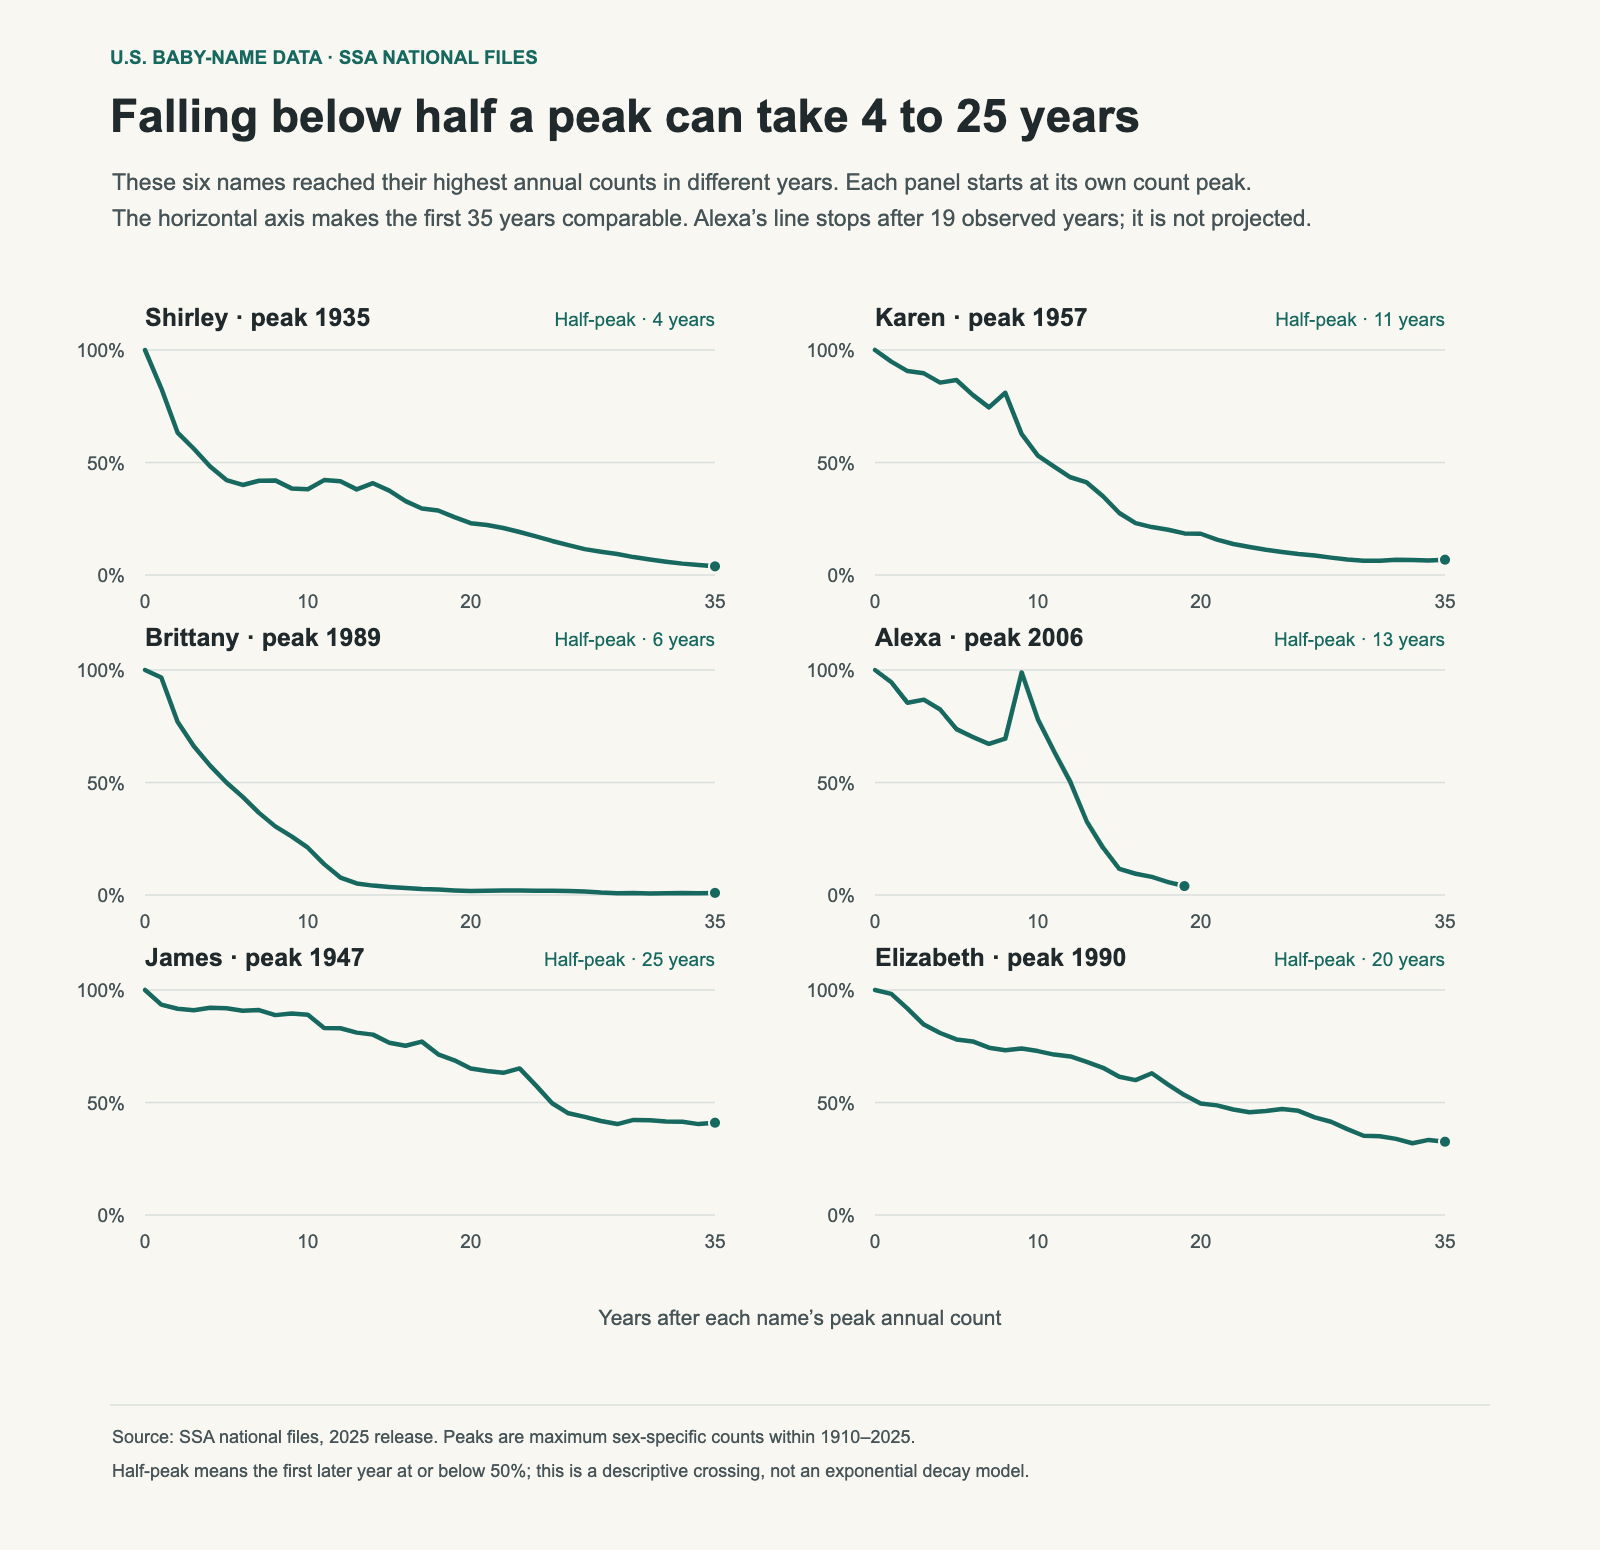
Shirley fell below half its highest annual count four years after its 1935 peak. James took 25 years after its 1947 peak. Brittany took six years, Karen eleven, Alexa thirteen and Elizabeth twenty.

These histories offer a way to compare persistence without calling every rising name a fad or every familiar name immune to decline. A name can lose a large share of its peak count and still remain near the top of the rankings.

Six panels align Shirley, Karen, Brittany, Alexa, James and Elizabeth to their maximum annual counts within 1910–2025. Half-peak crossings range from four to 25 years.
Each name starts at 100% of its own peak count. Fifty percent means half as many recorded babies, not half the ranking. The same horizontal scale shows the first 35 years; Alexa has only 19 post-peak years available.

What “half-peak” means here

For each name and sex, I found the largest annual count from 1910 through 2025. I then found the first later year with a count at or below half that maximum. It is a descriptive crossing, rather than a fitted scientific half-life. Names can rise again after crossing the line.

This distinction matters because the paths are uneven. They can have smaller recoveries, second peaks and periods of relative stability. A single number is useful for comparison, but it cannot replace the full curve.

NamePeak year · countYears to half2025 count2025 rank
Shirley1935 · 42,3664133#1581
Karen1957 · 40,59111175#1279
Brittany1989 · 37,7926281#928
Alexa2006 · 6,11713243#1029
James1947 · 94,7672511,945#6
William1947 · 67,0022510,545#9
Elizabeth1990 · 20,750206,760#17

James declined and stayed prominent

James fell from 94,767 boys in 1947 to 11,945 in 2025, a reduction of about 87%. Yet it ranked sixth in 2025. William also remained in the top ten, with 10,545 boys and rank nine. Elizabeth ranked seventeenth, with 6,760 girls.

Those examples show why “still popular” and “far below its peak” are compatible. The size of the cohort and the concentration of leading names have changed. A name does not need its mid-century count to retain a high position on today’s list.

The top-ten concentration chart supplies that wider context: popular names collectively cover a smaller share now. The count-based comparison here should be read beside shares if the question is how common the name feels within its generation.

Different peaks must be treated consistently

Alexa’s largest count in this window is 6,117 in 2006. It also had a later count of similar size, but starting the chart at a later high point would change the measured decline. The same peak rule is applied to all six panels rather than choosing a convenient starting year for one name.

The observation windows also differ. Thirty-five years after James’s peak is 1982; thirty-five years after Elizabeth’s is 2025. Alexa has not yet supplied 35 years of post-peak data. Its line stops in 2025 rather than extending an assumed decline.

The curve cannot identify a cultural cause

A famous bearer, product name or media association may influence naming choices. The annual counts do not record that influence directly. The curves cannot by themselves separate an external event from an existing decline or a broader change in taste.

It would therefore be misleading to describe all four girls’ names as a measured pop-culture category that always loses 95% of its use within fifteen years. The observed halfway crossings differ, and several declines began long before later cultural associations.

Compare persistence without treating it as a verdict

If you like a name, look for the shape that matters to you: a recent rise, a long plateau, or a decline from a much larger cohort. None is automatically better. A historical curve can tell you what use looked like; it cannot guarantee future popularity or whether your family will enjoy the name.

Compare names that later recovered and use a shared shortlist to keep the data connected to an actual choice.

Data and method

These calculations use the SSA’s pinned 2025 national release. “Published counts” means the sum of the name counts available for that year and sex. Names with fewer than five occurrences are withheld, so this denominator is not a complete count of all births. Historical records before 1937 are also incomplete. Peak counts are calculated separately by sex. Relative counts are divided by the observed peak, and no manually selected peak overrides are used. The CSV includes all available post-peak years; the chart displays at most 35.

Download the chart data (CSV). The SSA download page provides the original files, and its background notes describe coverage and spelling conventions.
055 / 59

Names Associated With Light and Water: Meaning and U.S. Trends

A name can have a documented connection to light or water, or simply evoke that image for your family. Both are useful ways to build a shortlist. The distinction matters when a baby-name list presents an attractive association as a literal translation.

Clara connects to a Latin word for clear or bright. Lucy and Lucia belong to a name family associated with light. River is an English nature word; Marina connects to the sea. Kai has a Hawaiian sea meaning, alongside other origins and uses. The same theme can lead to very different names and popularity histories.

NameConnection2025 U.S. count · rank
ClaraLatin Clarus: clear, bright, famousGirls: 3,601 · #63
LucyEnglish form of Lucia, in the light-associated name familyGirls: 6,176 · #24
LuciaFeminine form of Lucius, associated with Latin lux, lightGirls: 3,012 · #83
KaiHawaiian kai: sea; this is one language contextBoys: 3,768 · #93
RiverEnglish word for a flowing body of waterBoys: 3,139 · #111; girls: 1,401 · #219
MarinaFeminine form of Marinus, Latin “of the sea”Girls: 488 · #601

A similar-looking name need not have the same root

Lucas and Lucy look as though they belong to the same light family. The usual derivation of Lucas is “from Lucania”, a place name. If you like Lucas because it evokes brightness, that can be your personal association; it is different from stating that its literal meaning is “bringer of light.”

Names can also have more than one origin or interpretation. A short form used in several languages should be checked in the tradition you intend, rather than assigned whichever translation sounds most appealing. When the root is disputed, keep that uncertainty in your notes.

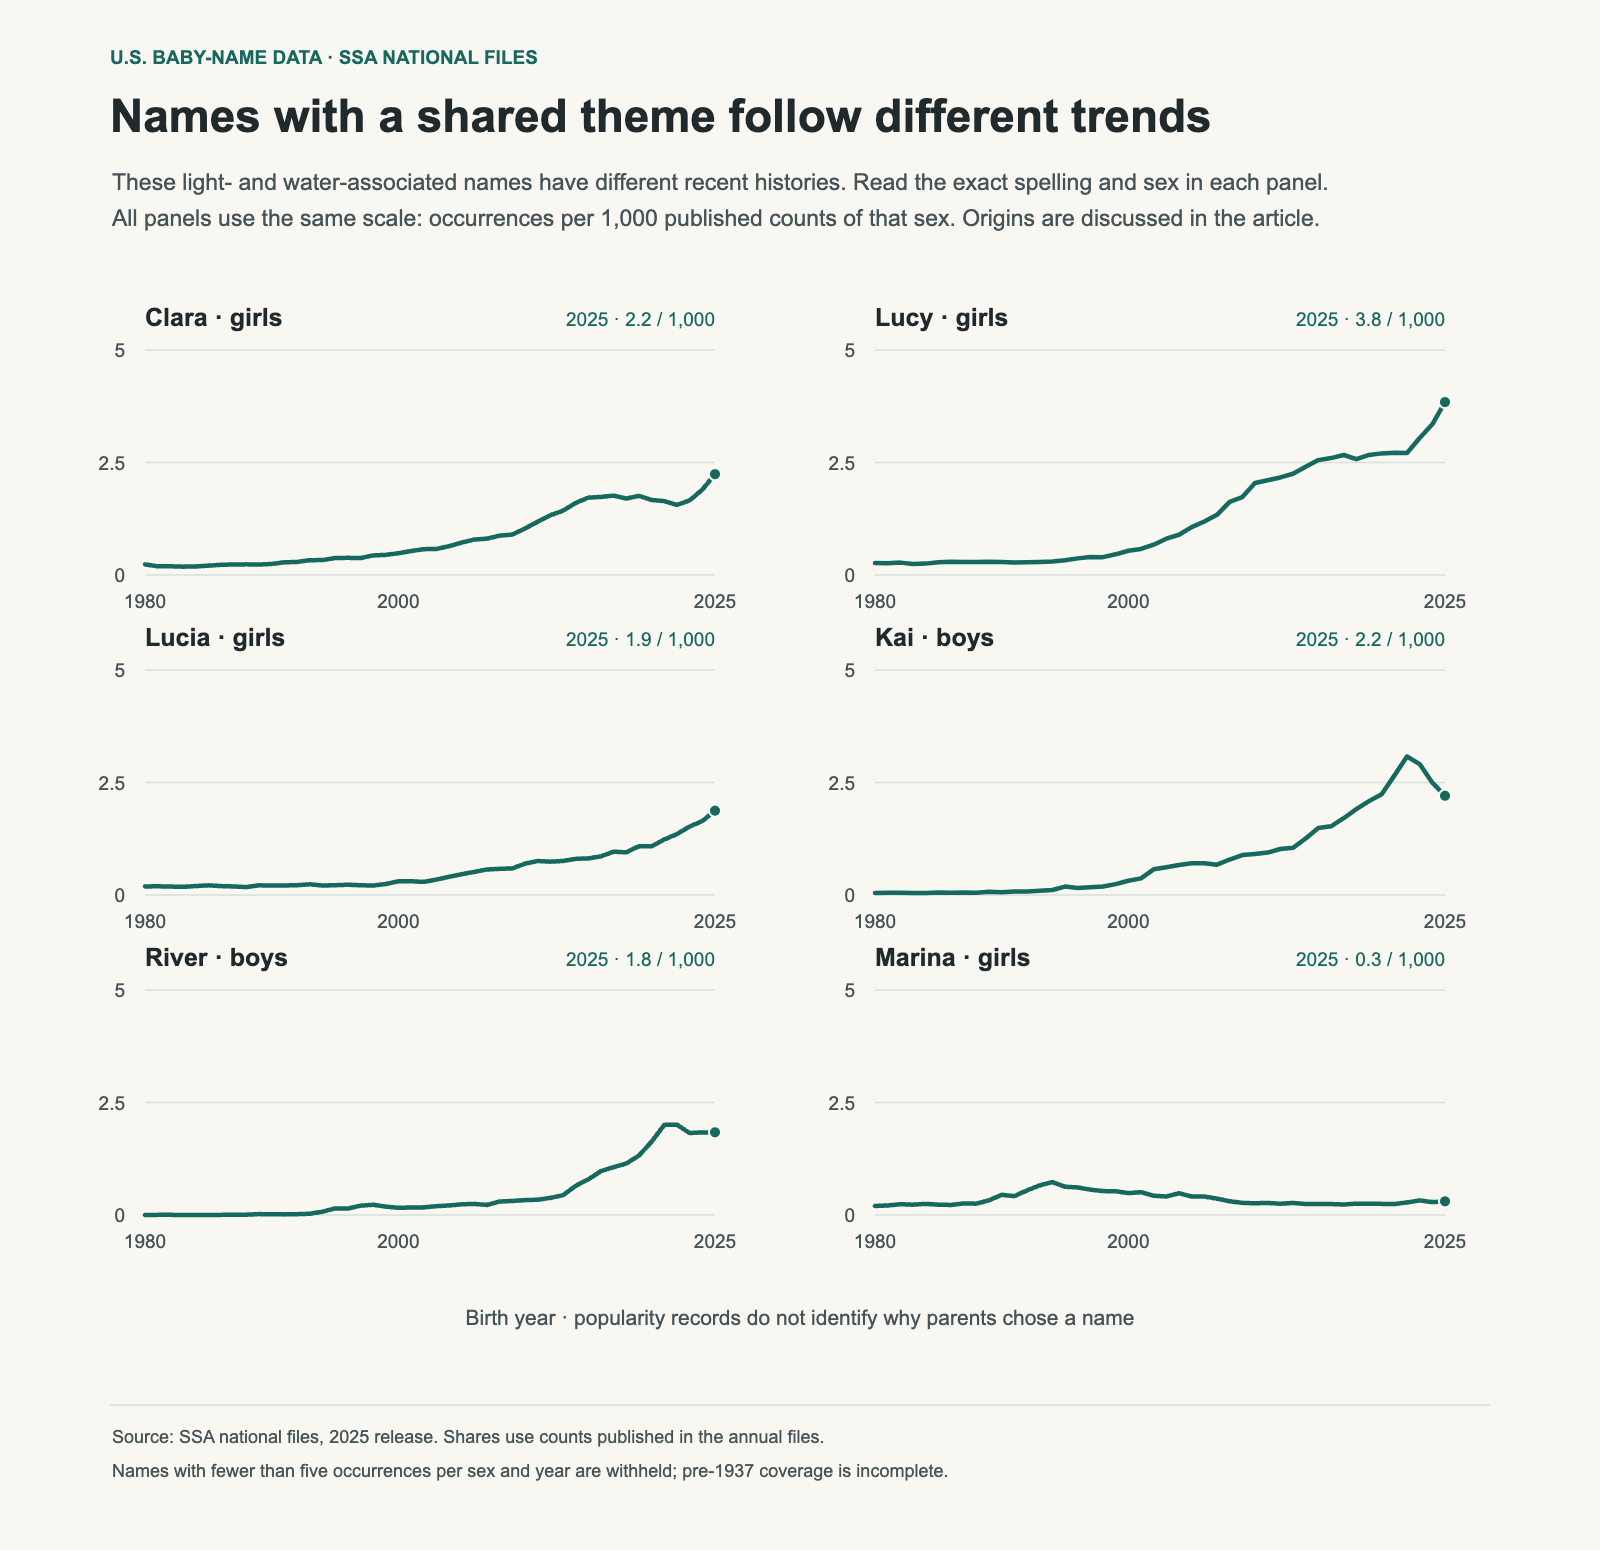
Six panels show 1980–2025 shares per 1,000 published counts for Clara, Lucy, Lucia, Kai, River and Marina, with each panel’s sex labeled.
These are exact-spelling U.S. records, not a measure of how many parents chose a light or water meaning. Each panel divides by its labeled sex’s published total. A shared theme does not produce a shared trend.

Light names have different recent paths

Clara moved from rank 167 in 2010 to 63 in 2025. Lucy moved from 75 to 24 over those years. Lucia ended 2025 at 83. They can all fit a light-associated shortlist without having the same count, sound or level of familiarity.

A recent rise is useful context, but does not establish why parents chose the name. The SSA files contain spelling, sex and count; they do not contain the meaning that a family had in mind. The chart measures use, rather than popularity of the theme itself.

Water names are not all still climbing

Kai’s published boys’ count reached 5,374 in 2022 and was 3,768 in 2025. River’s boys’ count reached 3,504 in 2021 and was 3,139 in 2025. Both remain much more visible than in 2010, but describing either as a continuously accelerating trend would miss the latest years.

Marina’s 2025 count was 488 girls. Choosing between Kai, River and Marina involves imagery, language, the sound you prefer, exact spelling and how much current familiarity you want.

Turn the theme into a usable shortlist

  1. Write down the intended connection. Is it a documented origin, a place important to your family, or an image you enjoy?
  2. Say the full name. Try the first name and surname, then any likely everyday short form.
  3. Check the language context. Confirm the pronunciation and meaning that matter to you with a reliable reference or a fluent speaker.
  4. Compare the exact spelling. Related forms have separate histories in the U.S. records.
  5. Choose together. A meaning can explain your affection for a name without becoming a requirement every candidate must satisfy.

For a practical comparison process, use the partner shortlist guide. For the data behind a trend, read how to interpret counts and decades.

Sources and method

Name origins are linked beside the entries. The Hawaiian dictionary is hosted by the University of Hawaiʻi at Hilo; the other references document their name derivations. U.S. counts and ranks use the SSA’s 2025 national release. The chart shows published occurrences per 1,000 counts of the same sex, not all possible births or uses in other countries. Download the chart data (CSV); original data: SSA national files.

056 / 59

How the Long-Name Gap Between Girls and Boys Narrowed, 1880–2025

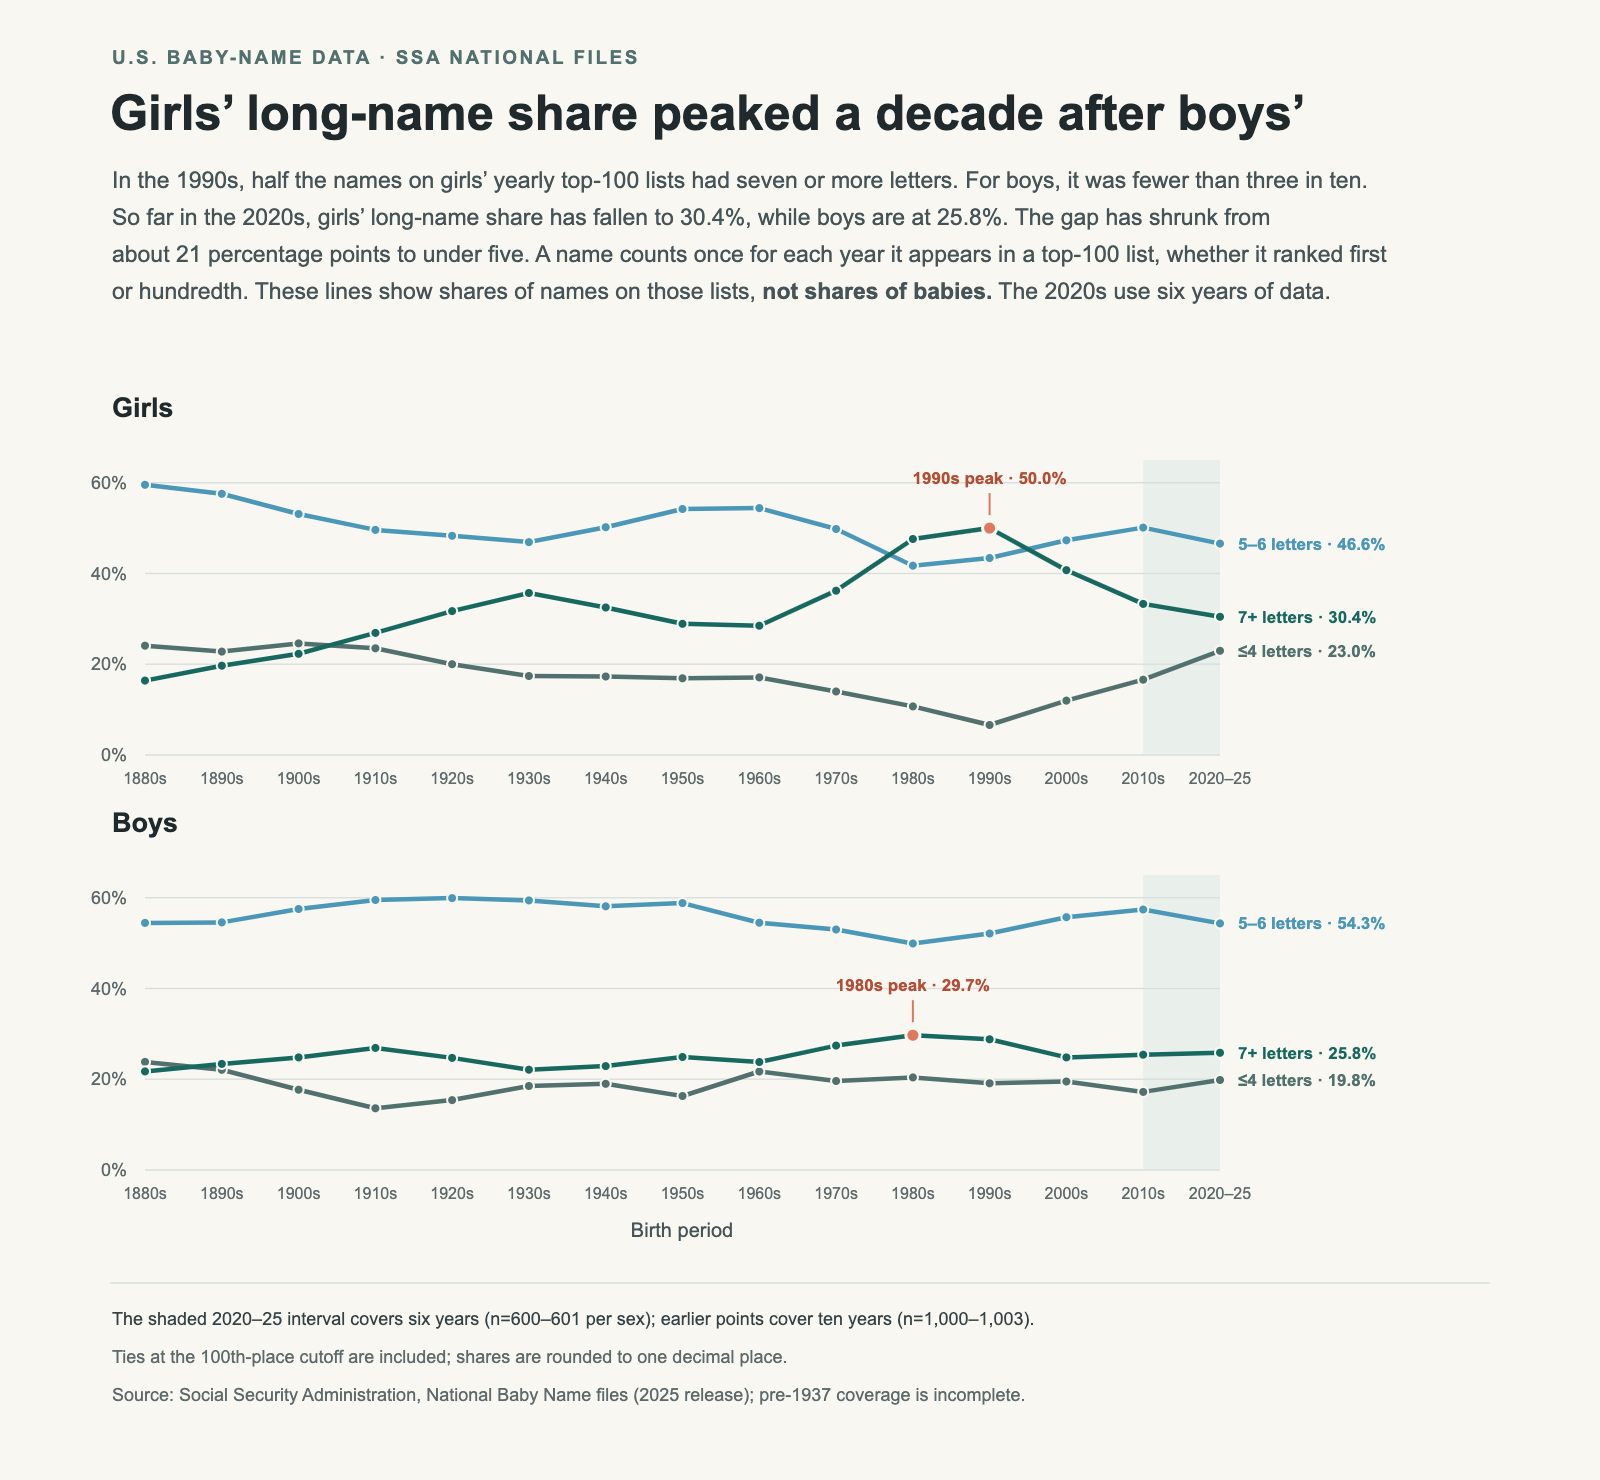
In the 1990s, half the names on girls’ yearly top-100 lists had seven or more letters. On boys’ lists, fewer than three in ten did. Jessica, Jennifer, Samantha and Stephanie all appeared in the girls’ top 100 throughout that decade. Long names occupied so much of the list that four-letter names such as Anna and Mary belonged to a small minority.

Across 2020–25, long names account for 30.4% of girls’ list entries and 25.8% of boys’ entries. The gap has narrowed from 21.2 percentage points to 4.6. Much of that change comes from the return of short girls’ names. But the lists have not become identical: girls’ names now occupy both the short and long ends more often, while boys’ names are more concentrated in the middle.

Three lines in each of two panels show the shares of short, five-to-six-letter and seven-plus-letter names in U.S. girls’ and boys’ yearly top-100 lists, from the 1880s through 2020–25. Girls’ long-name share peaks at 50% in the 1990s; boys’ peaks at 29.7% in the 1980s. The partial 2020–25 period is shaded.

Picture a top-100 list with every name printed on a card. In the 1990s, about 50 of the girls’ cards would have names at least seven letters long. In 2020–25, it would be about 30. Each card counts equally, whether its name ranked first or 100th. These percentages describe the names on the lists, not how many babies received them.

A few examples of each length, drawn from the historical lists:

  • 4 letters: girls Anna, Mary; boys John, Paul
  • 5 letters: girls Sarah, Alice; boys James, David
  • 6 letters: girls Martha, Evelyn; boys Thomas, Joseph
  • 7 letters: girls Kathryn, Lillian; boys William, Michael

The three lines group names into four or fewer letters, five to six, and seven or more. Each point pools the yearly lists within that period, so a name appearing in all ten years counts ten times. The shaded 2020–25 point uses the six years available so far.

Girls’ names did not always lean toward the long end

In the 1880s, nearly six in ten entries on girls’ lists had five or six letters. Only 16.4% had seven or more, compared with 21.7% on boys’ lists. Long names were a smaller part of the girls’ list at the beginning of this series.

That balance changed over several generations. Girls’ long-name share reached 26.9% in the 1910s and 35.7% in the 1930s. The rise then reversed for a while: the share slipped to 28.5% in the 1960s before climbing again. By the 1980s it was 47.6%, and in the 1990s it reached 50.0%, its highest point in the series.

The short end moved in the opposite direction over that longer stretch. Names of four or fewer letters accounted for 24.1% of girls’ entries in the 1880s, but just 6.6% in the 1990s. Anna and Mary still appeared in every annual top 100 in the 1990s; short names had become a much smaller group around them. Five- and six-letter names also remained common, at 43.4%.

Different names entered, stayed in, and left the top 100 over time.

Boys’ lists stayed closer to the middle

Five- and six-letter names form the largest group on boys’ lists in every period shown. Their share ranges from 49.9% in the 1980s to 59.9% in the 1920s. Names such as James, David, Thomas and Joseph illustrate that middle range; all four appeared in every annual boys’ top 100 in the 1880s, the 1990s and 2020–25.

Boys’ long-name share does change, but within a smaller range: from 21.7% in the 1880s to a peak of 29.7% in the 1980s. Girls reached their peak a decade later, and at a much higher level. In the 1990s, the girls’ list contained roughly 21 more long names per 100 entries than the boys’ list.

The recent convergence comes mainly from girls’ lists moving away from that peak. Since the 1990s, girls’ long-name share has fallen by 19.6 percentage points, while boys’ has fallen by 3.0.

Where did the girls’ long-name share go?

Most of the difference appears at the short end. The share of girls’ names with four or fewer letters rose from 6.6% in the 1990s to 23.0% in 2020–25, an increase of 16.4 percentage points. The middle group rose by a smaller 3.2 points, from 43.4% to 46.6%.

Emma, Ava, Mia and Luna each appear in all six girls’ top-100 lists from 2020 through 2025. Long names remain visible too: Charlotte, Elizabeth and Isabella also appear in every one of those six lists. A shrinking long-name share can coexist with individual long names remaining popular.

Share of list entries, by name length
PeriodList≤4 letters5–6 letters7+ letters
1880sGirls24.1%59.5%16.4%
1880sBoys23.8%54.4%21.7%
1990sGirls6.6%43.4%50.0%
1990sBoys19.1%52.1%28.8%
2020–25*Girls23.0%46.6%30.4%
2020–25*Boys19.8%54.3%25.8%

*Six years of an unfinished decade. Percentages are rounded independently and may not sum to exactly 100%.

Girls’ lists contain a larger share of both short names and long names than boys’ lists. Boys’ lists have more five- and six-letter names: 54.3%, compared with 46.6% for girls. Describing girls’ names simply as “longer” misses the growing short group.

Nearly the same average, with a different mix

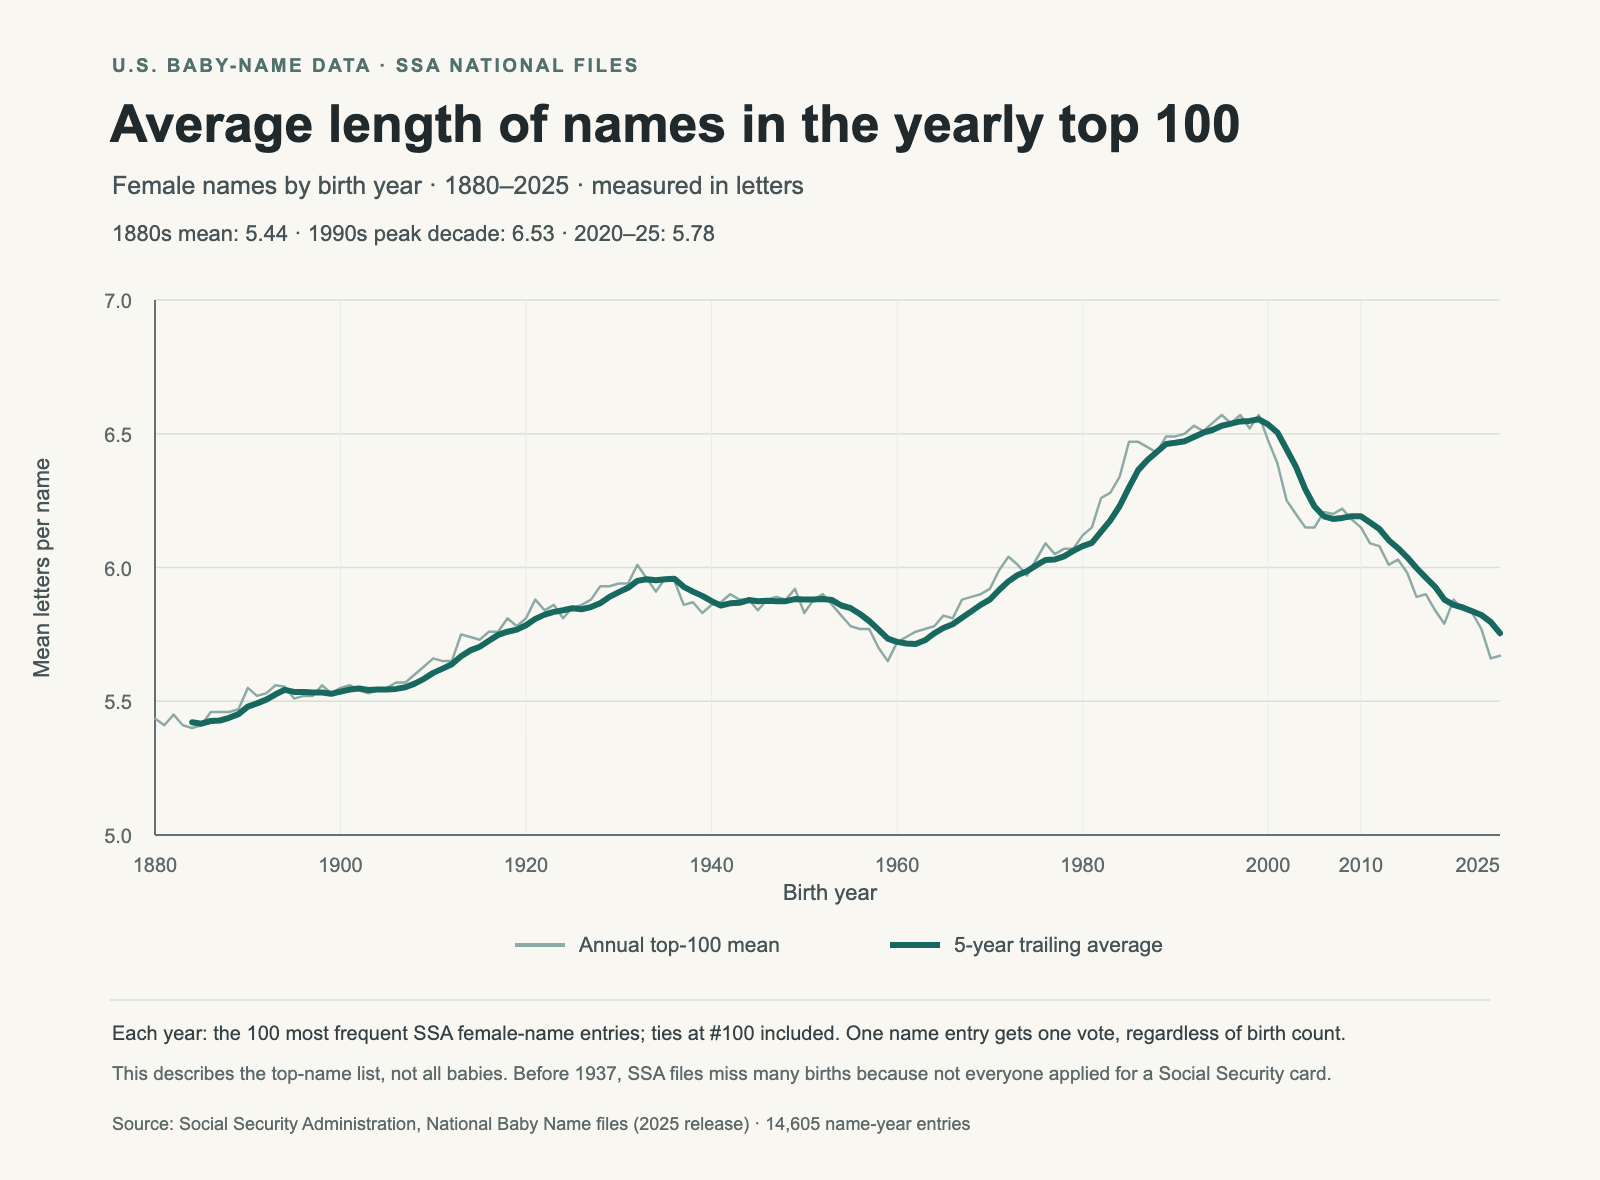
The average letter count provides another way to check the pattern. For girls’ yearly top-100 lists, the average rose from 5.44 letters in the 1880s to 6.53 in the 1990s, the highest completed-decade mean. It then fell to 5.78 across 2020–25.

Average letter count of female names in the U.S. yearly top 100, from 1880 through 2025. The five-year trailing average rises to about 6.5 letters around the end of the 1990s, then falls to about 5.8.
The pale line shows each year’s average; the dark line averages that year and the previous four. Every selected name has equal weight.

Boys’ average was 5.79 letters in the 1990s and is 5.75 across 2020–25. The difference between girls’ and boys’ averages has therefore narrowed from about three-quarters of a letter to just 0.02 letters. Those nearly equal averages conceal the different distributions in the three-line chart: girls have more names at both ends, and boys have more in the middle.

The mean also helps show that the girls’ shift is broader than a change around the seven-letter cutoff. Both the share of long names and the average length have fallen since the 1990s. The bands tell us where the mix changed; the average summarizes its overall length.

Why keep the unfinished 2020s?

Stopping at the 2010s would leave out the latest part of the story. Girls’ short-name share has risen from 16.6% in that decade to 23.0% across 2020–25, while their long-name share has fallen from 33.3% to 30.4%. The recent years continue the movement away from the 1990s peak.

The chart labels that point as 2020–25 and shades the final interval because six years do not represent a completed decade. Every earlier point pools ten annual lists. The 2020s point will change when later years are added; it describes the years observed, rather than predicting the decade’s final result.

How the lists were measured

I used one pinned release of the Social Security Administration’s national name files, covering birth years 1880 through 2025. For each year, female-name and male-name records were ranked separately by birth count. I selected the top 100 entries and included every name tied at the 100th entry’s count. Complete decades contain 1,000–1,003 name entries across their ten lists; 2020–25 contains 601 for girls and 600 for boys.

Each name counts once for each year it appears. A name that stays in the top 100 for a whole decade contributes ten entries; a name present for one year contributes one. The three bands cover every selected entry. Period shares divide the count in each band by the total number of entries in that period. The annual-average chart first averages the letter counts within each year; the period averages quoted above average those yearly means.

This weighting answers a specific question: what lengths were represented on the popular-name lists? It gives the first- and 100th-ranked names equal weight. Measuring the lengths of names actually received by babies would require weighting each name by its birth count. Names outside the top 100 would also need to be included for a population-wide answer.

What these charts cannot explain

Letter count is a spelling measure. It does not measure syllables, how long a name takes to say, or the nickname someone uses. Different spellings remain separate entries. The SSA also removes spaces and hyphens before tabulating names, so the length measured here is the length stored in its files. These conventions are described in the SSA’s data qualifications.

The early years need extra care. The SSA says many people born before 1937 never applied for a Social Security card, leaving their names out of the records. The 1880s figures describe the available historical records and should not be read as a complete census of births. See the SSA’s source and coverage notes.

The series shows when the mix changed, but cannot establish why parents chose those names. Explanations involving family traditions, celebrities or changing tastes would need evidence beyond these lists, such as surveys of parents or research connecting particular names to those influences.

Data and further reading

Download the counts and shares behind the three-line chart (CSV). The file includes each period’s start and end year, number of years included, and denominator, so the partial 2020s can be identified directly.

For another view of the annual rankings, read how the most popular names shift by decade or see how close rankings can hide a near tie. You can explore individual name histories in Name Scout.