YellowSquared  /  Field notes

Notes from the workshop

29 posts, newest first. Choose an app to narrow the feed.

017 / 29

What Is Chromatic Aberration in Photography? Purple Bokeh Fringing vs. Corner Color Edges Explained

Shoot a portrait wide open at f/1.4 against sunlit tree branches—or photograph silver silverware, architectural edges, or water droplets—and zoom in to 200%. Almost immediately, you will spot two completely different types of phantom color halos: glowing magenta and green outlines around slightly out-of-focus foreground and background highlights right in the center of the frame, or sharp cyan-red and blue-yellow splits hugging high-contrast edges in the extreme corners. Both artifacts are called chromatic aberration (CA), yet they are caused by two different geometric pathways inside your lens, respond oppositely when you stop down your aperture, and require completely different fixes in post-processing. As documented in Wikipedia's optical reference on Chromatic Aberration, laboratory camera-testing standards from Image Engineering, Photography Life, and the VR & AR Optics Wiki, knowing whether you are looking at Longitudinal (Axial) CA or Lateral (Transverse) CA is one of the most practical diagnostic skills in photography.

1. Why Glass Splits White Light: Dispersion and the Abbe Number (Vd)

A camera lens focuses light by refraction—bending incoming light waves as they cross from air (refractive index n ≈ 1.0003) into curved optical glass (n ≈ 1.43 to 1.85). However, as explained in optical dispersion physics, the refractive index of every transparent solid varies with wavelength (λ): short-wavelength violet and blue light (400–480 nm) travels more slowly through glass and bends at a steeper angle than long-wavelength red light (620–700 nm).

Optical engineers quantify how severely a glass formula splits the visible spectrum using the Abbe number (Vd), named after German physicist Ernst Abbe, which compares the glass's refractive index at yellow helium light (587.6 nm) against its spread between blue hydrogen (486.1 nm) and red hydrogen (656.3 nm):

  • Low Abbe Number (Vd < 45) = High Dispersion (Severe Color Split): Dense flint glasses (Vd ≈ 28–37) and optical plastics like polycarbonate break white light into wide rainbow fringes.
  • Moderate Abbe Number (Vd ≈ 55–65) = Standard Crown Glass: Classic borosilicate crown glass (such as Schott N-BK7, Vd = 64.2) has much lower dispersion than flint glass, which is why 18th-century telescope makers cemented a positive crown element to a negative flint element to create an achromatic doublet that brings two wavelengths (typically red and blue) to the same focus.
  • High Abbe Number (Vd > 80) & Anomalous Partial Dispersion (ED, UD, Fluorite & Phase Fresnel): Even in an achromatic doublet, green light still focuses slightly ahead of red and blue—creating a purple/green residual halo called the secondary spectrum. As Wikipedia's lens engineering overview details, modern apochromatic lenses eliminate this residual fringe using Extra-Low Dispersion (ED, Vd ≈ 81.5) glass, Ultra-Low Dispersion (UD / Super-ED, Vd ≈ 94.9) glass, monocrystalline Calcium Fluoride (CaF2 Fluorite, Vd = 95.2), or Diffractive Optical / Phase Fresnel (PF / DO) elements—which possess a negative Abbe number of Vd = -3.5 in visible light that directly cancels the positive dispersion of glass!
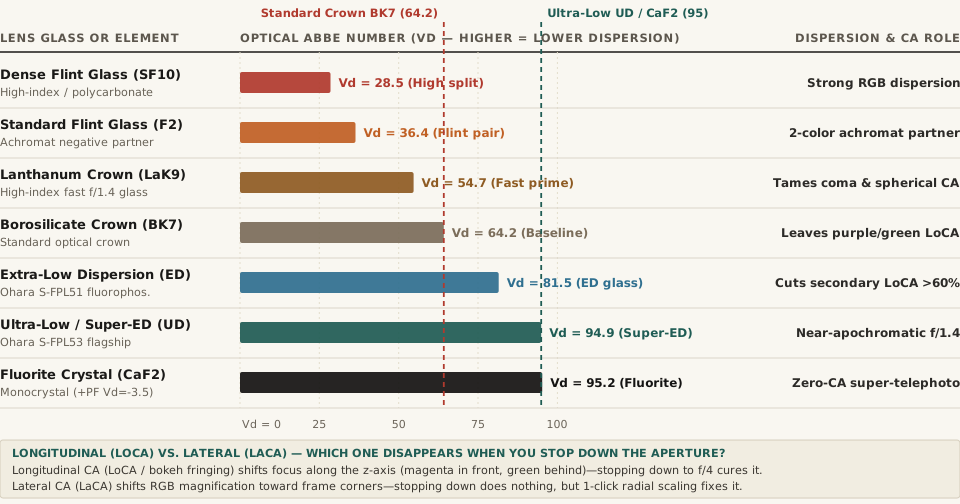
Chart comparing Optical Abbe Numbers (Vd, where higher values mean lower chromatic dispersion) across seven lens glass types from Dense Flint SF10 (28.5) and Standard Crown BK7 (64.2) to Extra-Low Dispersion ED (81.5), Super-ED/UD (94.9), and Calcium Fluoride Fluorite crystal (95.2)
Figure 1: Optical Abbe number (Vd) across seven camera lens glass tiers and their role in controlling axial and lateral dispersion (Wikipedia — Chromatic Aberration; Image Engineering; VR/AR Optics Wiki).

2. Longitudinal (Axial) CA vs. Lateral (Transverse) CA: How to Tell Them Apart

When inspecting a photo or batch of images, you can tell the two types of chromatic aberration apart in three seconds by checking where in the frame the fringe appears, what colors it displays, and what happens when you stop down the aperture (Image Engineering; Photography Life):

  1. Longitudinal / Axial Chromatic Aberration (LoCA — "Bokeh Fringing" Along the Z-Axis):
    • Physical Mechanism: Rays entering parallel to the optical axis focus at different distances in front of and behind the CMOS sensor plane. When green wavelengths are focused sharply on your subject's eyelashes, red and blue/violet wavelengths miss the focal plane along the depth (z) axis.
    • Visual Signature: Appears everywhere in the frame, including dead center, around high-contrast out-of-focus edges and specular bokeh balls. Out-of-focus highlights in front of the focal plane glow magenta/purple, while out-of-focus highlights behind the focal plane glow green.
    • How to Fix It: Because LoCA is a depth-of-focus mismatch, stopping down your aperture from f/1.4 to f/2.8 or f/4.0 dramatically reduces or eliminates it by expanding depth of field so all three color channels land within the acceptable circle of confusion. Conversely, automated 1-click lens corrections in raw editors cannot fix LoCA without manual defringe sliders that risk desaturating real magenta lips or green foliage.
  2. Lateral / Transverse Chromatic Aberration (LaCA / TCA — Radial Magnification Shift Across X/Y):
    • Physical Mechanism: When light enters the lens at a steep oblique angle away from the center, dispersion causes the effective focal length—and therefore the image magnification—to vary slightly between Red, Green, and Blue wavelengths on the exact same sensor plane.
    • Visual Signature: Completely absent (zero) in the exact center of the frame and grows progressively wider toward the outer edges and extreme corners. Appears on in-focus edges oriented tangentially (perpendicular to a radius drawn from the center), with one side of the object rimmed in cyan/blue and the opposite side rimmed in red/yellow.
    • How to Fix It: As Wikipedia and Image Engineering emphasize, stopping down the aperture has zero effect on Lateral CA because the magnification ratio between wavelengths does not change with aperture diameter. However, because the Red, Green, and Blue channels are all sharp and merely differ in radial scale by a fraction of a percent, checking "Remove Chromatic Aberration" in a raw converter fixes LaCA cleanly in one click by radially rescaling the R and B channels to align with G!

"Axial CA can be reduced by stopping down, which increases depth of field... Transverse chromatic aberration (TCA) is not affected by stopping down, as it is caused by the magnification of each wavelength of light differing within the lens."

3. Complete Data Table: Optical Glass Tiers & Longitudinal vs. Lateral CA Behavior

The reproducible table below—matching the companion CSV (chromatic-aberration-longitudinal-vs-lateral-abbe-number-and-lens-glass-dispersion.csv)—summarizes the refractive index, Abbe number (Vd), and practical aberration behavior across seven optical glass tiers:

Optical Glass / Element Tier Material Designation Refractive Index (nd) Abbe Number (Vd) Dispersion Class Effect on Longitudinal CA (LoCA) Effect on Lateral CA (LaCA)
Dense Flint Glass SF10 / Polycarbonate 1.728 28.5 Very High Dispersion Severe axial RGB focus shift if uncorrected Wide corner RGB magnification split
Standard Flint Glass F2 / N-F2 Flint 1.620 36.4 High Dispersion Negative element in 2-wavelength achromats Leaves residual purple secondary spectrum
Lanthanum High-Index Crown Rare-Earth LaK9 1.691 54.7 Moderate-Low Dispersion Controls spherical & sagittal coma in f/1.4 primes Moderate corner TCA; fixed by raw profile
Borosilicate Crown Glass Schott N-BK7 Crown 1.517 64.2 Standard Crown Baseline Positive partner in standard doublets Needs ED/UD pairing on wide & tele zooms
Extra-Low Dispersion (ED) Ohara S-FPL51 1.497 81.5 Extra-Low Dispersion Cuts magenta/green bokeh fringing by >60% Aligns RGB focal lengths across zoom range
Ultra-Low / Super-ED (UD) Ohara S-FPL53 1.439 94.9 Ultra-Low Dispersion Near-apochromatic axial focus at f/1.4–f/2.8 Minimal raw corner fringing on full-frame
Fluorite Crystal + Phase Fresnel Monocrystal CaF2 (+PF Vd=-3.5) 1.434 95.2 Anomalous Dispersion Eliminates axial color shift on 300–800mm primes Phase Fresnel (Vd = -3.5) cancels glass CA

When you are culling a portrait session or building side-by-side multi-photo grids and want to make sure wide-open f/1.4 frames match stopped-down f/2.8 frames without purple edge cast, Compare multi-photo grids in BatchPad before exporting your final sequence.
018 / 29

What Is the 'Moon Illusion'? Why the Moon Looks Huge on the Horizon (And How to Photograph It)

You are driving home at dusk when a glowing orange full Moon rises just above the distant hills and city skyline. To your eyes, the lunar disk looks colossal—easily twice as wide as it looks at midnight when floating high overhead. Excited, you pull over, hold up your smartphone or wide-angle camera, and snap a photo. When you look at your screen, the massive Moon your eyes are still staring at has shrunk into a microscopic white pinprick lost in an ocean of sky.

Why does the rising or setting Moon look enormous to human vision, yet refuse to show up large in a wide-angle photograph? Recorded since clay tablets in ancient Mesopotamia and analyzed by Aristotle (~330 BC), Ptolemy, Leonardo da Vinci, and Immanuel Kant, the Moon illusion is one of the most powerful perceptual tricks in nature. Even more astonishing: if you measure the Moon with a precision theodolite or telephoto lens, the horizon Moon is actually 1.5% smaller in true angular diameter than the overhead zenith Moon! Here is the astronomy, the neuroscience, and the exact telephoto distance math for capturing a giant Moon next to a landmark.

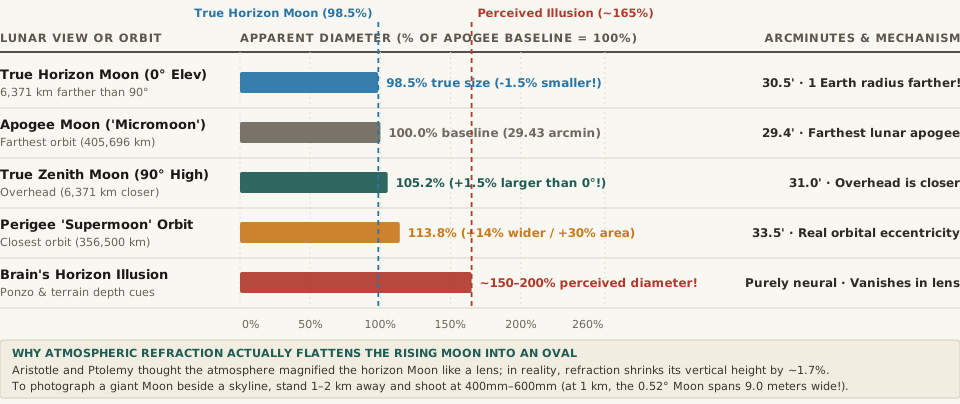
Horizontal bar chart comparing the apparent diameter of the Moon across the true horizon Moon (98.5%), apogee Micromoon (100%), zenith Moon (105.2%), perigee Supermoon (113.8%), and the human brain's horizon Moon illusion (165%)
Figure 1: True angular diameter versus perceived diameter (% of apogee full Moon baseline = 29.43 arcminutes), contrasting the 1.5% smaller physical horizon Moon against the +14% perigee Supermoon and the +50% to +100% perceptual Moon Illusion. Download the full dataset: moon-illusion-horizon-vs-zenith-angular-size-perigee-apogee-and-telephoto-scale.csv.

1. Why the Horizon Moon Is Actually 1.5% Optically Smaller (And Squashed by Refraction)

When people first learn that the giant rising Moon is an optical illusion, their first guess is almost always atmospheric physics: “Doesn't the Earth's atmosphere act like a magnifying glass when you look through a thicker layer of air at the horizon?”

As proven by astronomers and detailed in Wikipedia's optical breakdown of the Moon illusion, the physical reality is the exact opposite in two ways:

  1. You Are 6,371 Kilometers (1 Earth Radius) Farther Away at Moonrise: When the Moon sits directly overhead at your local zenith (90° elevation), you are standing on the top of the Earth's sphere—roughly 6,371 km (3,959 miles) closer to the Moon than the center of the Earth. Six hours earlier, when the Moon was sitting on your eastern horizon (0° elevation), your viewing position was rotated 90 degrees to the side of the globe, making the Moon roughly 1.5% farther away (~384,400 km vs. ~378,029 km) and therefore 1.5% smaller in true angular diameter!
  2. Atmospheric Refraction Compresses the Moon Vertically (Into an Oblate Oval): Rather than magnifying the lunar disk laterally, differential atmospheric refraction bends light rays from the bottom limb of the rising Moon (closer to the horizon, passing through denser air) slightly more upward than rays from the top limb—squashing the vertical diameter of the horizon Moon by about 1.7% (roughly 0.5 arcminutes) while leaving its horizontal width unchanged.

You can prove this to yourself tonight without any camera gear: hold a small pea or aspirin tablet (8.4 mm / 0.33 inches wide) at arm's length (64 cm / 25 inches) with one eye closed. It will just barely eclipse the “giant” Moon on the horizon—and four hours later, when the Moon is high in the sky and looks tiny, that exact same pea at arm's length will cover it by the exact same margin (or view the horizon Moon upside-down between your legs, which immediately breaks the terrain context and shrinks the Moon by half!).

“When the Moon sits on the horizon, you are one full Earth radius (6,371 km) farther away from it than when it passes overhead—making the 'giant' rising Moon 1.5% optically smaller than the zenith Moon.”

2. How Your Visual Cortex Scales Up the Horizon Moon: Emmert's Law & Oculomotor Cues

If the image projected onto your retina is 0.52 degrees wide at both the horizon and the zenith, why does your visual cortex insist that the horizon Moon is 50% to 100% larger? As reviewed in Ross and Plug's The Mystery of the Moon Illusion and Royal Society psychophysical studies, two neural size-constancy mechanisms combine:

  • The Flattened Sky Dome & Ponzo Distance Cues (Emmert's Law): Your brain's visual cortex calculates perceived physical size by multiplying an object's retinal angular size by its assumed distance (Perceived Size = Retinal Angle × Perceived Distance). When you look at the horizon across miles of receding buildings, trees, mountains, and cloud decks, rich perspective cues tell your subconscious visual system that the horizon lies very far away. When you crane your neck to look straight up into an empty, featureless sky vault, the lack of intermediate depth cues makes the sky dome feel much closer. Because both Moons subtend the same 0.52° retinal angle, your brain automatically scales up the “distant” horizon Moon just like the top bar in a Ponzo railroad-track illusion!
  • Oculomotor Convergence and Relative Size Framing: When you gaze across a detailed horizon, your eyes focus at optical infinity, whereas staring into blank overhead darkness causes the eye's ciliary muscles to relax inward to a resting “dark focus” distance of just 1 to 2 meters (triggering oculomotor micropsia, which makes overhead objects look smaller). Simultaneously, seeing the 0.52° Moon framed right next to tiny distant house chimneys or treetops on the horizon (an Ebbinghaus relative-size contrast) reinforces its perceived scale.

3. How to Photograph a Giant Moon Next to a Landmark: The 9-Meters-Per-Kilometer Rule

Note carefully the difference between the nightly Moon Illusion (a 50–100% neural effect between horizon and zenith on the same night) and a real orbital Perigee “Supermoon” (which occurs when the full Moon coincides with the closest point of its elliptical orbit at ~356,500 km vs. ~405,696 km at apogee, producing a real +13.8% increase in angular diameter from 29.43 to 33.50 arcminutes, or +30% in disk area):

Lunar Position, Orbit or Lens Setup True Angular Size (Arcminutes) Size vs. Apogee Baseline (%) Image Width on 45MP Full-Frame Sensor Physical, Optical or Perceptual Mechanism
True Horizon Moon (0° Elevation) 30.50' (0.508°) 98.5% (−1.5% smaller!) 0.21 mm on 24mm (50 px) Observer is 1 Earth radius (6,371 km) farther away at moonrise
Apogee Full Moon (“Micromoon”) 29.43' (0.491°) 100.0% Baseline 0.21 mm on 24mm (49 px) Farthest point in elliptical lunar orbit (~405,696 km)
True Zenith Moon (90° Overhead) 30.96' (0.516°) 105.2% (+1.5% vs. 0°) 0.22 mm on 24mm (51 px) Overhead observer is 6,371 km closer to the Moon
Perigee Full Moon (“Supermoon”) 33.50' (0.558°) 113.8% (+30% area) 0.23 mm on 24mm (55 px) Closest orbital perigee (~356,500 km); real physical size gain
Brain's Horizon Moon Illusion 30.50' true ~150%–200% perceived! Neural cortex scaling Ponzo terrain distance cues & oculomotor dark-focus shift
400mm Telephoto (Subject at 1 km) 31.00' (9.0 m wide @ 1 km) 1,667% lens magnification 3.61 mm on 400mm (830 px!) Standing 1–2 km back shrinks the foreground landmark to match the Moon!

The Photographer's Rule of 110 (9 Meters of Moon Width per Kilometer)

How do professional photographers capture those jaw-dropping viral photos where a rising full Moon looks as wide as a lighthouse, the Space Needle, or a mountain peak—without Photoshop compositing? Because the Moon's angular diameter is roughly 0.52 degrees (0.00908 radians, or ~1/110th of a radian), the Moon's apparent physical width compared to a foreground subject at distance D is simply:

Apparent Moon Width at Subject = D / 110 ≈ 9.08 meters per kilometer (or 48 feet per mile)

If you stand 50 meters from a 9-meter-wide lighthouse with a 24mm phone lens, the lighthouse fills your frame while the Moon (which never changes its 0.52° angle) is a tiny speck. But if you walk 1.0 kilometer (0.62 miles) back from the lighthouse and zoom in with a 400mm to 600mm telephoto lens, that 9-meter-wide lighthouse shrinks to the exact same 0.52-degree angular width as the Moon—so the rising Moon completely fills the frame behind the lighthouse, recreating on your camera sensor the exact dramatic scale your brain experiences during the Moon Illusion!

Line Up Moonrise Azimuths, Elevations, and Twilight in PhotoSpots

Because the rising Moon moves half a degree every two minutes and only looks balanced in exposure against a city skyline when moonrise occurs during civil twilight (15 to 25 minutes around sunset), nailing a 400mm telephoto Moon alignment requires knowing the exact compass bearing and elevation angle ahead of time. Track lighting ephemeris in PhotoSpots to calculate exact moonrise azimuths, golden-hour overlap windows, and shooting vectors for your next session.

019 / 29

What Is the '500 Rule' (and NPF Rule) for Photographing Stars Without Blur Trails?

Every beginner tutorial on photographing the Milky Way from a fixed tripod teaches the same piece of dark-sky folklore: the “500 Rule.” Divide 500 by your lens focal length in millimeters (for example, 500 / 24mm = 20.8 seconds, or 500 / 14mm = 35.7 seconds), set your shutter to that number, and your stars will allegedly come out as crisp, round pinpoints without motion blur from the Earth's rotation. Then you get home, open your RAW files on a laptop monitor, and discover that every single star in the sky has stretched into a pill-shaped dash 8 to 12 pixels long.

Why does the 500 Rule systematically fail on modern mirrorless and DSLR cameras—and why did astrophotographers replace it with the NPF Rule (developed by French amateur astronomer Frédéric Michaud of the Société Astronomique du Havre)? Here is the exact angular velocity math of star trails, why a rule invented for 1970s 35mm film grain breaks down on 24-to-61-megapixel digital sensors, and a side-by-side shutter speed lookup table for every popular wide-angle lens.

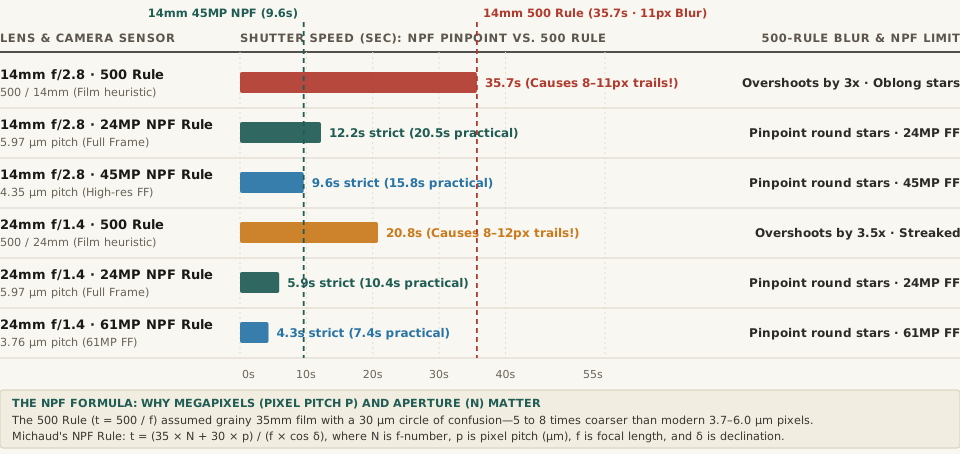
Horizontal comparison chart of maximum un-tracked astrophotography shutter speeds in seconds under the classic 500 Rule versus the NPF Rule across 14mm and 24mm lenses on 24MP, 45MP, and 61MP full-frame sensors
Figure 1: Maximum un-tracked tripod shutter speed (seconds at celestial equator δ = 0°) comparing the classic 500 Rule against the strict and practical NPF Rule on 24MP, 45MP, and 61MP full-frame cameras. Download the full dataset: astrophotography-500-rule-vs-npf-rule-shutter-speeds-and-star-trail-blur.csv.

1. Why Stars Trail: Earth's Sidereal Rotation (15.04 Arcseconds per Second)

Relative to the distant stars, the Earth completes one full 360° sidereal rotation in 23 hours, 56 minutes, and 4.09 seconds (86,164.09 seconds). Divide 360 degrees (1,296,000 arcseconds) by 86,164.09 seconds, and you get the fundamental angular velocity of the night sky at the celestial equator (declination δ = 0°):

ω = 15.041 arcseconds per second (or 15.04° per hour)

As explained in optical analyses of fixed-tripod star trail blur, the apparent linear speed at which a star image creeps across your camera sensor depends on two geometric factors: your lens's real focal length (f) and the star's celestial declination (δ):

Linear Trail Length on Sensor (mm) = f × ω × t × cos(δ) = f × (0.00007292 rad/sec) × t × cos(δ)

Notice the cosine of declination (cos δ) term: stars near the celestial equator (such as Orion's Belt at δ ≈ 0°, where cos 0° = 1.0) move across your frame at the maximum possible speed, while stars near the north or south celestial pole (such as Polaris at δ = +89.26°, where cos 89.26° = 0.013) barely move at all.

2. Why the 1970s “500 Rule” Produces 8-to-12-Pixel Trails on Digital Sensors

Where did the number 500 come from? On a 35mm film camera (36 × 24 mm frame), optical engineers defined the standard acceptable Circle of Confusion (CoC) for an 8×10-inch print viewed at arm's length as 0.030 mm to 0.035 mm (30 to 35 micrometers, μm). If you plug a 0.036 mm maximum tolerable trail length at the celestial equator (cos δ = 1) into the sidereal drift formula above:

t = 0.03646 mm / (f × 0.00007292 rad/s) = 500 / f

That worked fine on grainy ISO 400 color negative film where the dye clouds themselves were 15 to 25 μm wide. However, modern digital full-frame sensors pack vastly smaller photoreceptors (pixel pitch p):

  • 24-Megapixel Full Frame (6000×4000 px): Pixel pitch is 5.97 μm (0.00597 mm)—meaning a 0.0365 mm trail from the 500 Rule smears every star across 6.1 to 7.7 consecutive pixels!
  • 45-Megapixel Full Frame (8192×5464 px): Pixel pitch shrinks to 4.35 μm—stretching a 500-Rule exposure across 8.4 to 10.6 pixels.
  • 61-Megapixel Full Frame (9504×6336 px, or 26MP APS-C): Pixel pitch drops to 3.76 μm—turning a 500-Rule exposure into a 10-to-12-pixel streak.

“The 500 Rule was mathematically derived for a 30-to-36-micrometer film circle of confusion. On a modern 24MP to 61MP sensor with 3.8-to-6.0-micrometer pixels, a 500-Rule exposure drags every equatorial star across 8 to 12 pixels.”

3. How the NPF Rule Works—and the Complete Lens Lookup Table

To replace the outdated 500 Rule with a physics-based formula for digital sensors, French astronomer Frédéric Michaud formulated the NPF Rule—named after its three optical inputs: N (aperture f-number, which sets the size of the optical Airy diffraction disk), P (sensor pixel pitch in micrometers, μm), and F (focal length in millimeters):

tNPF (seconds) = k × (16.856 × N + 0.0997 × f + 13.713 × p) / (f × cos δ) ≈ (35 × N + 30 × p) / (f × cos δ)

Here, the strict factor (k = 1.0, or the standard simplified formula divided by ~1.7) keeps star elongation completely imperceptible at 100% pixel-peeping zoom, while a practical tolerance factor (k ≈ 1.7, the standard simplified (35N + 30p) / f formula) limits trail elongation to barely noticeable levels for full-screen and print viewing. Compare the exact shutter times across popular astrophotography lenses at the celestial equator (δ = 0°):

Lens Focal Length & Sensor Resolution Classic 500 Rule (500 / f) 500-Rule Trail Blur (Pixels) Strict NPF Shutter (100% Zoom Pinpoint) Practical NPF Shutter (Clean Print / Web) Pixel Pitch & Optical Behavior
14mm f/2.8 on 24MP Full Frame 35.7 sec (~30s) 7.7 px blur 12.2 sec 20.5 sec 5.97 μm pitch; 20s gives clean stars without tracker
14mm f/2.8 on 45MP Full Frame 35.7 sec (~30s) 10.6 px blur 9.6 sec 15.8 sec 4.35 μm pitch resolves finer angular drift
20mm f/1.8 on 24MP Full Frame 25.0 sec 7.7 px blur 7.5 sec 13.1 sec 5.97 μm pitch; fast f/1.8 gathers 2.4× more light than f/2.8
24mm f/1.4 on 24MP Full Frame 20.8 sec (~20s) 7.7 px blur 5.9 sec 10.4 sec Classic fast prime; 10s at f/1.4 matches 40s at f/2.8 in light!
24mm f/1.4 on 61MP Full Frame 20.8 sec (~20s) 12.2 px blur 4.3 sec 7.4 sec 3.76 μm pitch; 500 Rule overshoots strict NPF by nearly 5×
50mm f/1.8 on 24MP Full Frame 10.0 sec 7.7 px blur 3.0 sec 5.2 sec Normal focal length magnifies sky rotation; stack 15–20 frames

Why Cutting Shutter Speed From 20s to 10s Doesn't Ruin Your Image

Beginners often worry that dropping from a 20-second 500-Rule exposure to a 10-second NPF exposure at 24mm loses one full stop of light. In practice, two techniques make the 10-second NPF shot dramatically superior: first, a 24mm f/1.4 lens shooting for 10 seconds at f/1.4 collects twice as many total photons as a 14mm f/2.8 lens shooting for 20 seconds at f/2.8 (because f/1.4 lets in 4× the light per second of f/2.8). Second, taking 8 to 12 consecutive 10-second NPF exposures and aligning/median-stacking the sky in software (such as Sequator or Starry Landscape Stacker) yields the low-noise equivalent of an 80-to-120-second tracked exposure while keeping every star a razor-sharp 1-to-2-pixel sphere.

Plan Dark-Sky Windows, Moonless Nights, and Ephemeris Angles in PhotoSpots

Before you pack your tripod and wide-angle prime, knowing the exact minute astronomical twilight ends, when the Moon sets below the horizon, and at what azimuth and elevation the Milky Way Galactic Core rises makes all the difference in the field. Track lighting ephemeris in PhotoSpots to plan moonless dark-sky windows, solar and lunar angles, and golden-hour transitions for any location.

020 / 29

What Causes a Sun Dog and a 22° Halo Around the Sun or Moon?

Look up at the sun on a crisp morning when a thin, milky veil of high cirrostratus clouds drifts across the sky—or look up at a bright full moon on a frosty winter night—and you will often spot one of two spectacular optical geometries: either a complete luminous ring encircling the sun or moon at a constant radius (a 22° halo), or two vivid, rainbow-tinted "mock suns" glowing directly to the left and right of the sun at the exact same elevation above the horizon (sun dogs, known in atmospheric physics as parhelia). As documented by the National Weather Service and HyperPhysics optical calculations, both phenomena are created by the exact same optical building block: six-sided hexagonal ice crystals acting as miniature 60° prisms in the upper troposphere.

Why do ice crystals lock onto an angle of 21.84° (~22°) regardless of where you stand on Earth, why is the sky inside a 22° halo noticeably darker than the rest of the sky, what determines whether you see a full circular halo versus a pair of sun dogs, and how do you measure and frame 22° in the field? Here is the complete atmospheric optics guide—and how to track solar elevation and golden-hour angles in PhotoSpots.

The 60° Hexagonal Ice Prism: Why Light Cannot Bend by Less Than 21.84°

In the upper troposphere—at altitudes between 5 and 10 kilometers (16,000 to 33,000 feet), or near the ground in sub-freezing winter air as diamond dust—water vapor freezes into microscopic six-sided (hexagonal) ice crystals. When a ray of sunlight or moonlight enters one of the six side faces of a hexagonal crystal and exits through an alternating side face (skipping one face in between), the two faces form a classic equilateral prism with an apex angle of A = 60°.

In classical optics, a prism of apex angle $A$ and refractive index $n$ bends light by a minimum possible angle—the angle of minimum deviation (D_min):

D_min = 2 * arcsin(n * sin(A / 2)) - A

Plugging in $A = 60^\circ$ ($\sin 30^\circ = 0.5$) and the refractive index of ice (n_ice = 1.31):

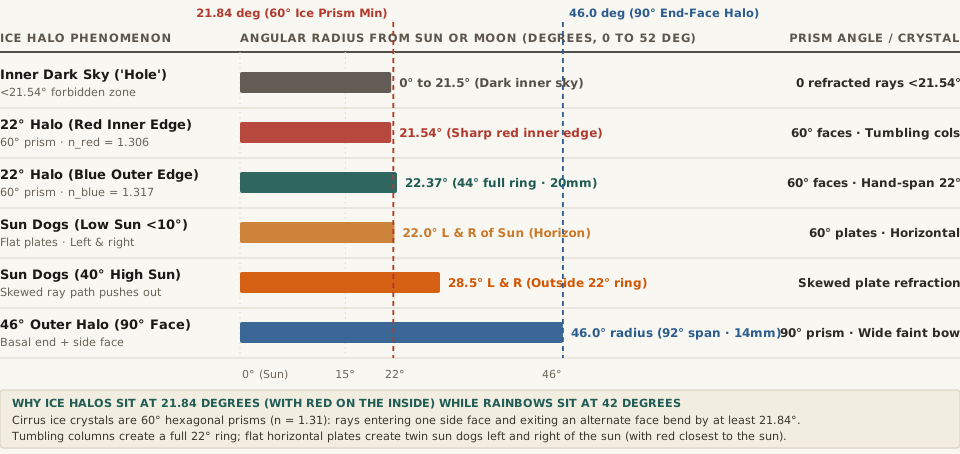
  • Red Light (650 nm, n_red = 1.306): Minimum deviation is 2 * arcsin(1.306 * 0.5) - 60° = 21.54°.
  • Yellow-Green Mean Light (n = 1.310): Minimum deviation is 21.84° (rounded in meteorology to 22°).
  • Blue-Violet Light (430 nm, n_blue = 1.317): Minimum deviation is 2 * arcsin(1.317 * 0.5) - 60° = 22.37°.

That simple prism equation explains two visual signatures you can spot immediately in any 22° halo or sun dog photograph:

  1. The Dark "Hole in the Sky" Inside 21.54°: Because it is physically impossible for a 60° ice prism to refract a ray of light by less than 21.54°, zero refracted rays are deflected into the disk of sky between the sun and the 21.54° inner edge—making the sky inside the 22° halo look starkly darker than the sky outside!
  2. Red Is Always on the Inside Edge: Because red light bends slightly less (21.54°) than blue light (22.37°), red always forms the sharp inner border closest to the sun, while yellow, green, and blue fade outward into white light.
Horizontal bar chart showing angular radius from the Sun or Moon in degrees: Inner Dark Sky (0 to 21.54 deg), 22° Halo Red Inner Edge (21.54 deg), 22° Halo Blue Outer Edge (22.37 deg), Sun Dogs at Low Sun (22.0 deg), Sun Dogs at 40° High Sun (28.5 deg), and 46° Outer Halo (46.0 deg).
Figure 1: Angular radius from the center of the Sun or Moon (in degrees) across the dark inner sky zone, the 21.54°–22.37° circular halo, low-sun and high-sun parhelia (sun dogs), and the 46° 90-degree-prism halo. Source: Wikipedia — Sun Dog, Halo & HyperPhysics.

22° Halo vs. Sun Dogs (Parhelia): Why Crystal Shape and Orientation Matter

If both 22° halos and sun dogs are caused by 60° hexagonal ice crystals, why do some days produce a full circle while other days produce two dazzling spots on either side of the sun?

  • Tiny Tumbling Columns (< 20.5 µm) → Full 22° Circular Halo: When ice crystals grow as short, pencil-shaped hexagonal columns smaller than ~20.5 micrometers, air turbulence tumbles them randomly in all 3D orientations. Because crystals are tilted at every possible angle around the clock face, they refract sunlight equally in a complete 360-degree circle of 22° radius around the sun or moon.
  • Larger Flat Hexagonal Plates (> 30 µm) → Twin Sun Dogs (Parhelia): When ice crystals grow as flat, wafer-like hexagonal plates larger than ~30 micrometers, aerodynamic drag causes them to drift downward with their flat faces aligned horizontally like falling leaves. With their side faces standing vertically like windowpanes, they can only refract sunlight horizontally to the left and right of the sun—concentrating the light into two brilliant colored spots at the exact same altitude as the sun!
  • Why Sun Dogs Drift Outward When the Sun Climbs Higher: When the sun sits right on the horizon (0° elevation), sun dogs sit directly on the 22° halo ring. As the sun climbs higher in the sky (20° to 40° elevation), sunlight enters the flat horizontal plates at a skewed diagonal angle, increasing the effective prism path and pushing the sun dogs outside the 22° halo (out to 28.5° at a 40° sun elevation, before vanishing entirely above 61°!).

Extend your arm fully in front of you and spread your fingers wide: from the tip of your thumb to the tip of your pinky is almost exactly 20° to 22°—meaning if you cover the sun with your thumb, a sun dog or 22° halo will sit right at the tip of your pinky finger.

Field Photography & Weather Lore: The 20–24mm Lens Rule and Warm Fronts

For landscape photographers, ice halos offer both an optical framing rule and an accurate 24-hour weather forecast:

  • Required Focal Length (44° Full Ring Diameter): Because a 22° halo has a radius of 22° around the sun, its full circular diameter is 44°. On a 35mm full-frame camera in landscape orientation (where vertical field of view is the limiting dimension), a 50 mm lens (27° vertical FOV) or 35 mm lens (38° vertical FOV) will clip the top and bottom of the halo. To frame the entire 44° circle (plus foreground), you need a 20 mm to 24 mm full-frame lens (47°–55° vertical FOV)—and if a rare 46° halo (90° end-face refraction, 92° full diameter) appears, you need a 12 mm to 14 mm ultra-wide lens.
  • Why a 22° Halo Predicts Rain or Snow Within 18–24 Hours: High cirrostratus ice clouds form at the leading upper wedge of an advancing warm front. Seeing a bright 22° solar or lunar halo is a classic empirical indicator that a frontal system is approaching and precipitation will likely arrive within 18 to 24 hours.

Complete Reference Table of Ice Halos, Sun Dogs & Camera Angles

The table below compares crystal geometries, prism angles, minimum deviation radii, color orders, and camera focal lengths across atmospheric ice halos (full dataset in sun-dog-and-ice-halo-refraction-angles-cirrus-crystal-optics.csv):

Atmospheric Ice Halo Crystal Shape & Orientation Prism Angle Angular Radius from Sun Color Order (Inner → Outer) Full-Frame Lens Needed
Dark Sky Inside 22° Halo Hexagonal prisms (No rays) 60° faces 0.0° to 21.54° Dark unlit sky ("Hole") 35–50 mm
22° Halo (Red Inner Edge) Random tumbling columns (< 20.5 µm) 60° faces 21.54° (n = 1.306) Sharp Red inner border 20–24 mm (44° diameter)
22° Halo (Blue Outer Edge) Random tumbling columns (< 20.5 µm) 60° faces 22.37° (21.84° mean) Red → Yellow → Blue/White 20–24 mm full-frame
Sun Dogs (Low Sun < 10°) Horizontal flat plates (> 30 µm) 60° vertical 22.0° Left & Right Vivid Red inner → White tail 24–28 mm (Both dogs)
Sun Dogs (High Sun 40°) Horizontal flat plates (Skew path) 60° skewed 28.5° Left & Right Red → Blue (Outside 22° ring) 16–20 mm ultra-wide
46° Large Halo Random columns (End + side face) 90° faces 45.3° to 46.4° (~46°) Red inner → Blue outer (Faint) 12–14 mm (92° diameter)

Planning sunrise, sunset, or moonrise shoots when sun dogs are brightest near the horizon? Track lighting ephemeris in PhotoSpots to see exact solar altitude and azimuth lines for any location.

021 / 29

Why Does Stopping Down to f/16 or f/22 Make Photos Softer? Lens Diffraction and the Airy Disk Explained

Set up a tripod in front of a mountain lake at sunrise, dial your camera's aperture all the way down to f/16 or f/22 so both the wildflowers at your feet and the peaks five miles away are in focus, and inspect the resulting RAW file at 100% magnification on your monitor. Instead of biting, crystalline detail, every pine needle, rock texture, and distant ridge looks slightly veiled — as if shot through a thin smear of petroleum jelly. Your lens isn't defective and your tripod didn't shake: you crossed the diffraction limit.

As derived from wave optics in Wikipedia's Technical Reference on the Airy Disk and Fraunhofer Diffraction and tested across modern camera sensors in Photography Life's Optical Diffraction & Sensor Pixel Pitch Analysis, forcing light through a tiny f/16 or f/22 aperture hole causes light waves to bend and interfere with one another — projecting every point of light as a blurred bullseye pattern called an Airy disk. Before your next landscape shoot, Plan golden-hour landscape shoots in PhotoSpots and pair optimal light angles with your sensor's true sharpest aperture.

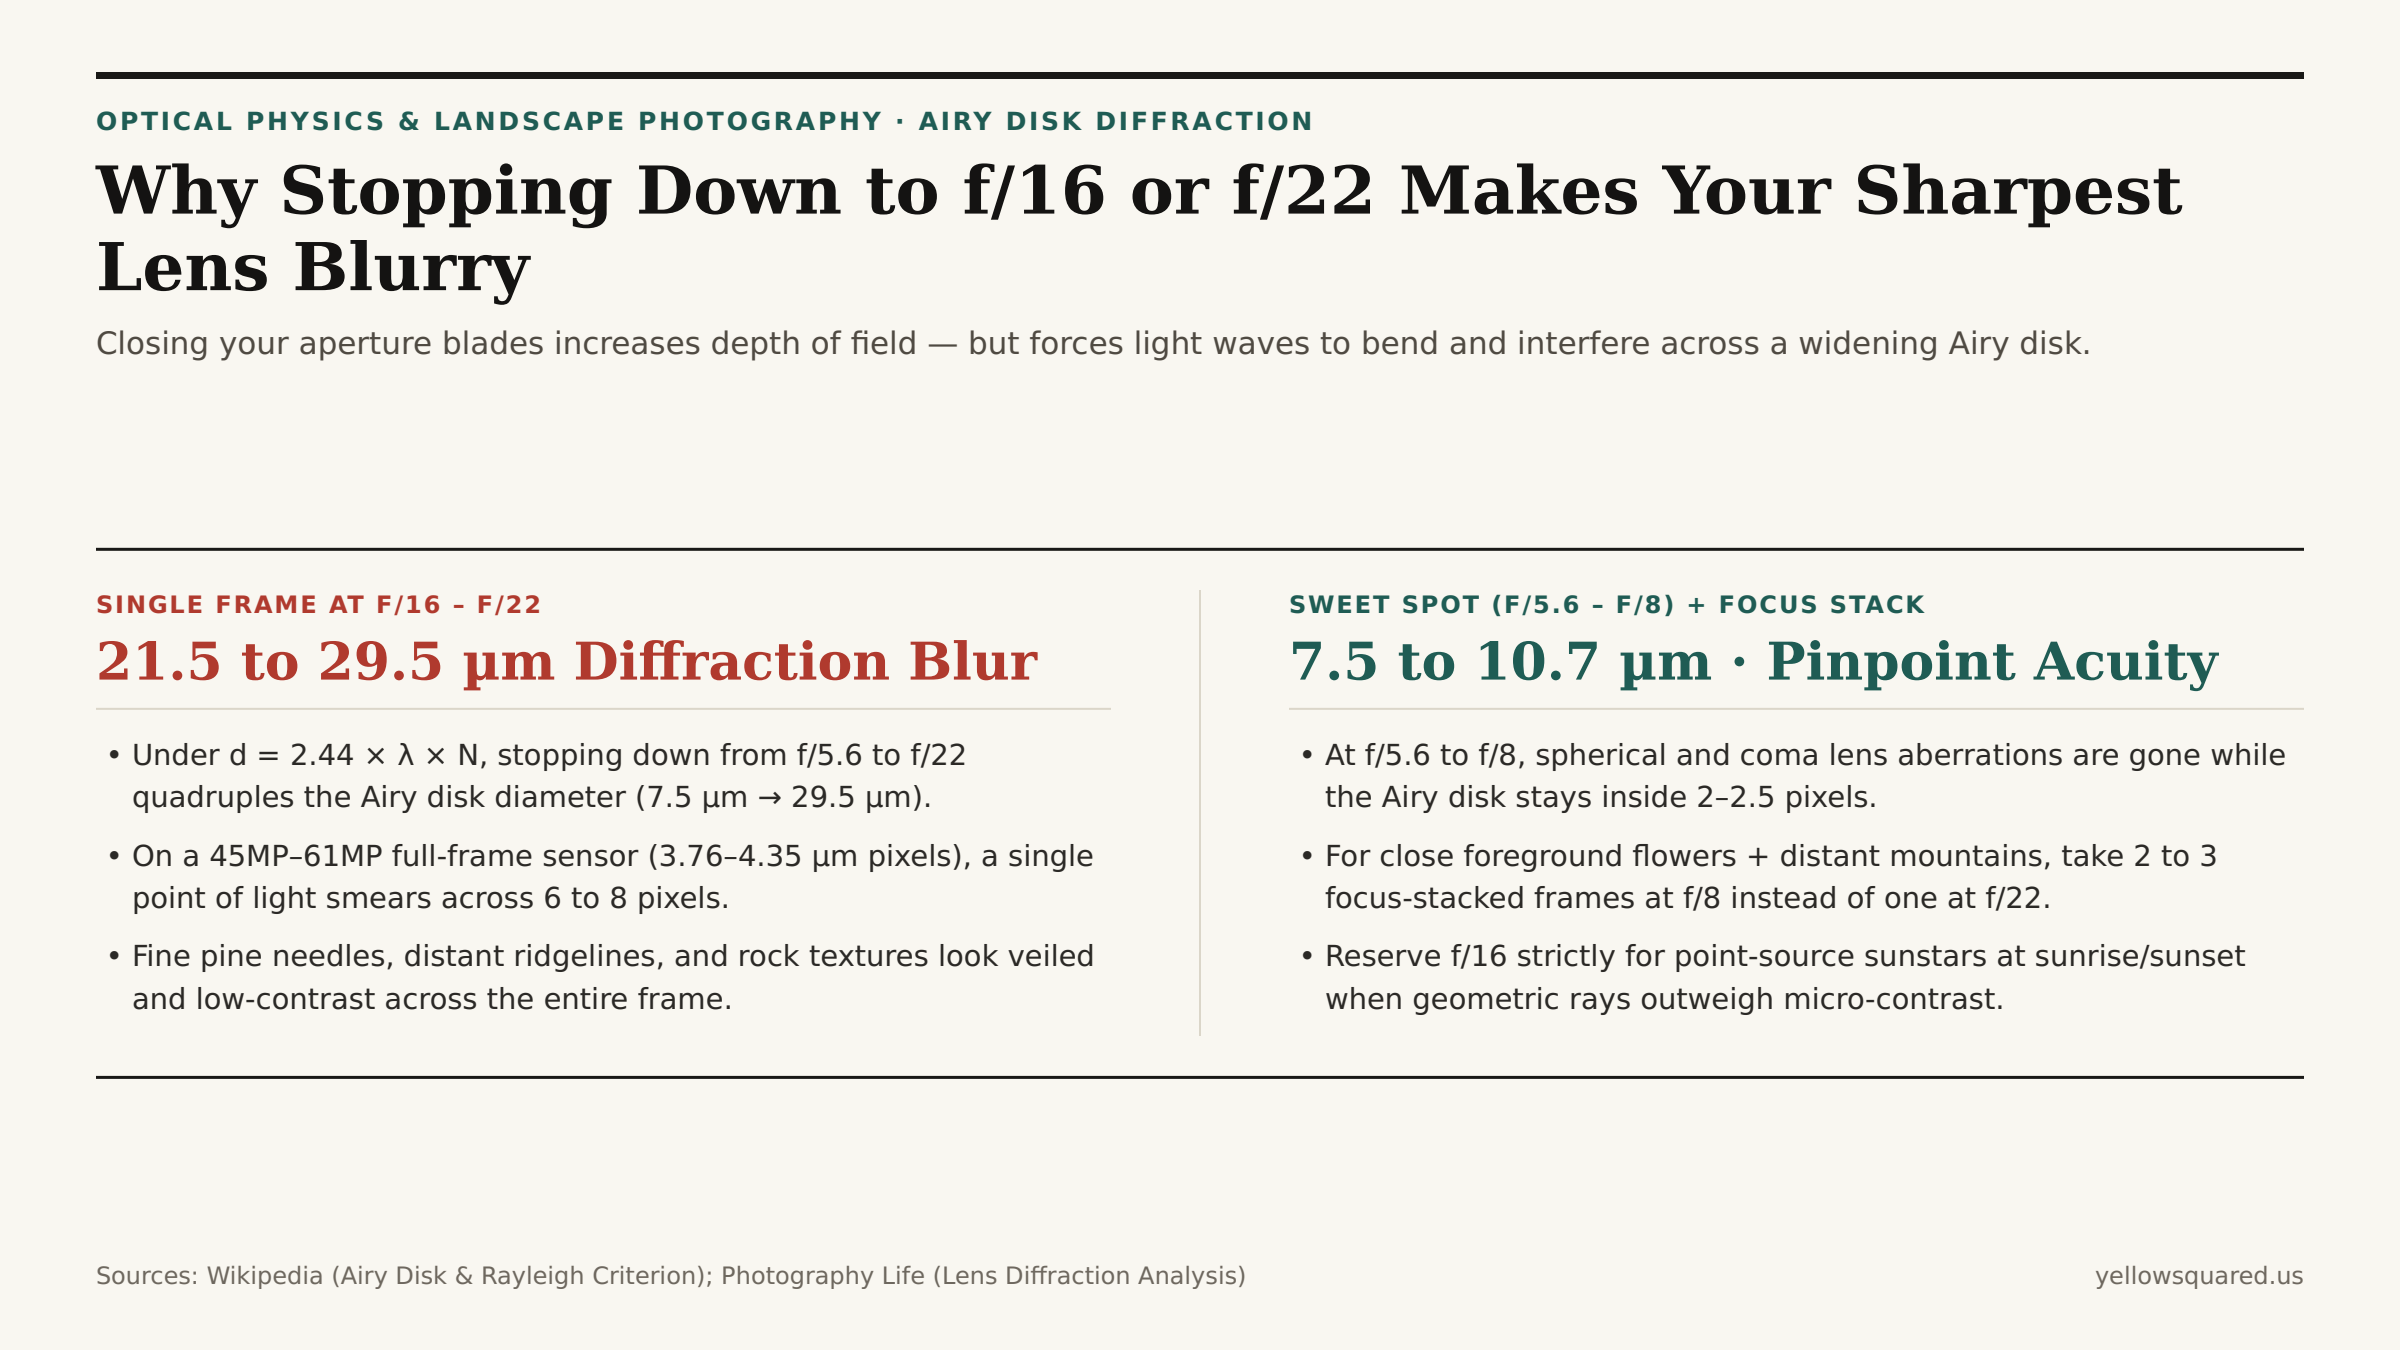
Comparison between shooting a single landscape frame at f/16 to f/22 (producing a 21.5 to 29.5 micrometer Airy disk that smears across 6 to 8 pixels on a 61MP sensor) versus shooting at the f/5.6 to f/8 sweet spot (7.5 to 10.7 micrometer Airy disk) and focus stacking
Stopping down from f/5.6 to f/22 quadruples the diameter of the diffraction Airy disk (7.5 µm to 29.5 µm), smearing every fine edge across nearly 8 pixels on a 61-megapixel full-frame sensor.

1. The Airy Disk Formula (d = 2.44 × λ × N): Why Smaller Holes Make Bigger Blur Circles

When you stop a lens down from wide open (f/1.4 or f/2.8) to f/5.6, image sharpness across the frame improves because blocking the outer edges of the glass elements eliminates optical imperfections (spherical aberration, coma, and field curvature). However, light is an electromagnetic wave (wavelength λ ≈ 0.55 µm / 550 nm in the middle of the green visible spectrum). When light waves pass through a circular aperture opening, the waves skimming the iris blades diffract (bend outward) and interfere constructively and destructively on the sensor plane.

Even with a mathematically flawless lens, a pinpoint star or pine needle is projected onto your sensor as a bright central spot surrounded by faint concentric rings — the Airy disk (Wikipedia Airy Disk) — whose diameter to the first dark ring is governed solely by wavelength (λ) and f-number (N):

d (micrometers) = 2.44 × λ × N ≈ 1.342 × N (for 550 nm green light)

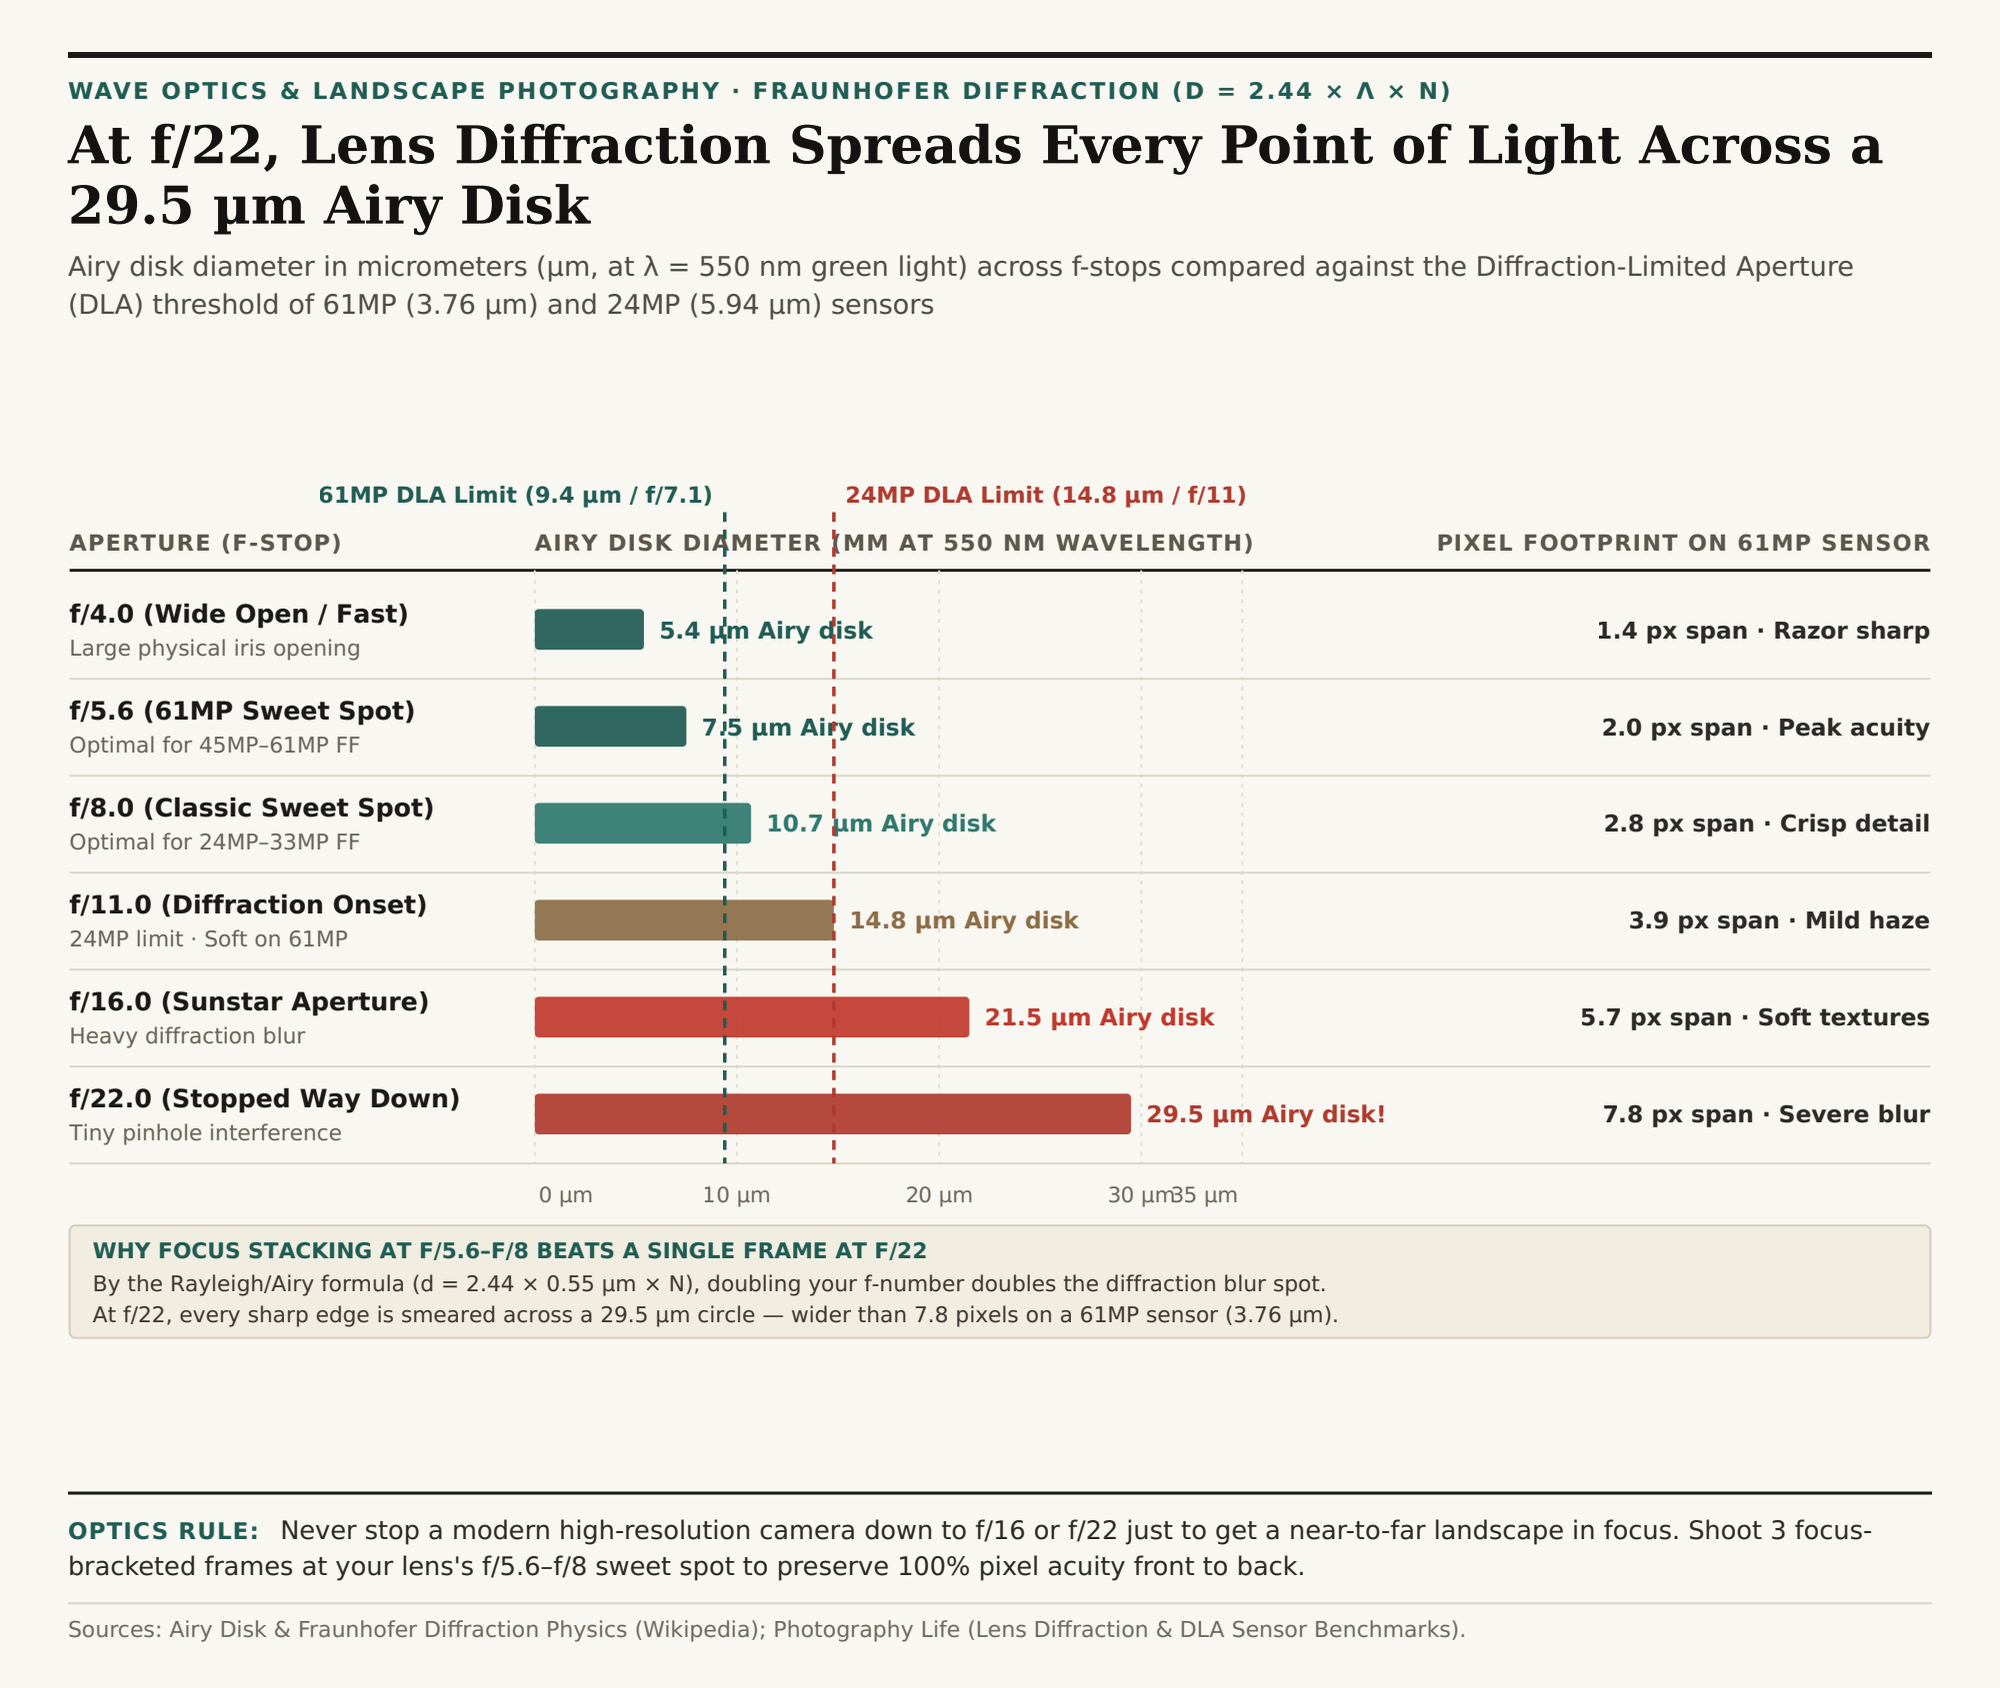
Notice what that equation means: Airy disk size depends only on your f-stop (N), completely independent of focal length! Whether you are shooting a 16mm ultra-wide or a 400mm telephoto, stopping down to f/16 projects a 21.5 µm Airy disk on the sensor, and stopping down to f/22 projects a 29.5 µm Airy disk.

Horizontal bar chart comparing Airy disk diameter in micrometers at 550nm green light across f/4 (5.4 um), f/5.6 (7.5 um), f/8 (10.7 um), f/11 (14.8 um), f/16 (21.5 um), and f/22 (29.5 um) against 61MP and 24MP sensor DLA thresholds
Airy disk diameter (µm at λ = 550 nm) and pixel span on a 61MP full-frame sensor across f-stops. Download the lens diffraction & Airy disk dataset (CSV).

2. Diffraction-Limited Aperture (DLA): Why 45MP–61MP Cameras Show Blur Sooner

Under the Rayleigh criterion, two adjacent points of detail become indistinguishable when the center of one Airy disk falls inside the first dark ring of its neighbor. In digital photography, diffraction begins visibly softening pixel-level micro-contrast as soon as the Airy disk diameter exceeds roughly 2 to 2.5 times your sensor's pixel pitch (p) — a threshold known as the Diffraction-Limited Aperture (DLA) (Photography Life):

  • 24MP Full Frame (p = 5.94 µm, Sony a7 III / Nikon Z6 III): DLA sits near f/9.5 to f/11 (Airy disk = 14.8 µm). You can shoot at f/8 or f/11 with crisp pixel sharpness, while f/16 (3.6 pixels wide) and f/22 (5.0 pixels wide) visibly soften fine textures.
  • 45MP Full Frame (p = 4.35 µm, Nikon Z8 / Z7 II / Canon EOS R5): DLA drops to f/7.1 to f/8 (Airy disk = 10.7 µm). By f/11, diffraction is already trimming micro-contrast; by f/16, the Airy disk spans 4.9 pixels.
  • 61MP Full Frame (p = 3.76 µm, Sony a7R V / Leica M11) & 26MP APS-C (p = 3.76 µm): DLA arrives at f/6.3 to f/7.1. Shooting at f/22 smears every point of light across 7.8 pixels (29.5 µm ÷ 3.76 µm) — effectively throwing away your high-resolution sensor's resolving power and reducing real detail to that of a 10-megapixel camera!

"Note: A 61MP image shot at f/16 is not 'blurrier' than a 24MP image shot at f/16 when both are printed at the same physical size — because the 21.5 µm Airy disk is the exact same physical size on both sensors. Rather, stopping down to f/16 erases the resolution advantage of the 61MP sensor."

Lens Aperture Airy Disk (550 nm) Span on 24MP (5.94 µm) Span on 61MP (3.76 µm) Ideal Sensor Match & Use Case
f/4.0 5.4 µm 0.9 pixels 1.4 pixels Zero diffraction; great for distant subjects
f/5.6 7.5 µm 1.3 pixels 2.0 pixels Peak optical sweet spot for 45MP–61MP sensors
f/8.0 10.7 µm 1.8 pixels 2.8 pixels All-around landscape sweet spot (24MP–45MP)
f/11.0 14.8 µm 2.5 pixels 3.9 pixels Safe ceiling on 24MP; mild softening on 61MP
f/16.0 21.5 µm 3.6 pixels 5.7 pixels Use only for 14-point sunstars or water motion
f/22.0 29.5 µm 5.0 pixels 7.8 pixels Avoid; replace with f/8 focus stacking or ND filter

When to Focus Stack at f/8 Instead of Stopping Down to f/22

For most lenses, f/8 is a useful place to start when you need detail. Use f/16 or f/22 when the extra depth matters more than the small loss of fine sharpness.

Instead of cranking your aperture to f/22 to force a foreground rock 2 feet away and a mountain 5 miles away into a single frame (or to slow down your shutter speed for silky waterfalls), keep your lens at f/5.6 to f/8: use a 3-stop or 6-stop Neutral Density (ND) filter to lengthen water exposures without aperture diffraction, or shoot 2 to 3 focus-bracketed frames at f/8 (focused at 3 feet, 10 feet, and infinity) and merge them in post. Plan golden-hour landscape shoots in PhotoSpots to map your compositions before sunrise, and download the Airy disk & lens diffraction CSV dataset.

022 / 29

Why the 500 Rule Fails on Modern Cameras: How the NPF Rule Prevents Star Trails

Every introductory astrophotography tutorial teaches the 500 Rule: divide 500 by your lens focal length (500 / 24mm = 20.8 seconds) to find the longest shutter speed you can use on a fixed tripod before Earth's rotation turns stars into streaks. Yet when you shoot a 20-second Milky Way exposure at 24mm on a modern 45-megapixel or 61-megapixel full-frame camera and zoom in, every star in the sky is stretched into an oblong, 6-to-7-pixel pill. The 500 Rule did not break because Earth spun faster — it broke because digital sensor pixels shrank to a fraction of the size of 1980s film grain.

To replace that outdated film-era heuristic with real optical physics, French amateur astronomer Frédéric Michaud derived the NPF Rule — an equation analyzed in Camera Decision's High-Resolution Sensor & NPF Rule Technical Analysis and Galactic Hunter's Astrophotography Comparison of the 500 Rule vs. NPF Rule. Before heading out for your next new-moon shoot, Plan dark-sky astrophotography shoots in PhotoSpots to align your NPF shutter window with galactic core rise times and azimuth angles.

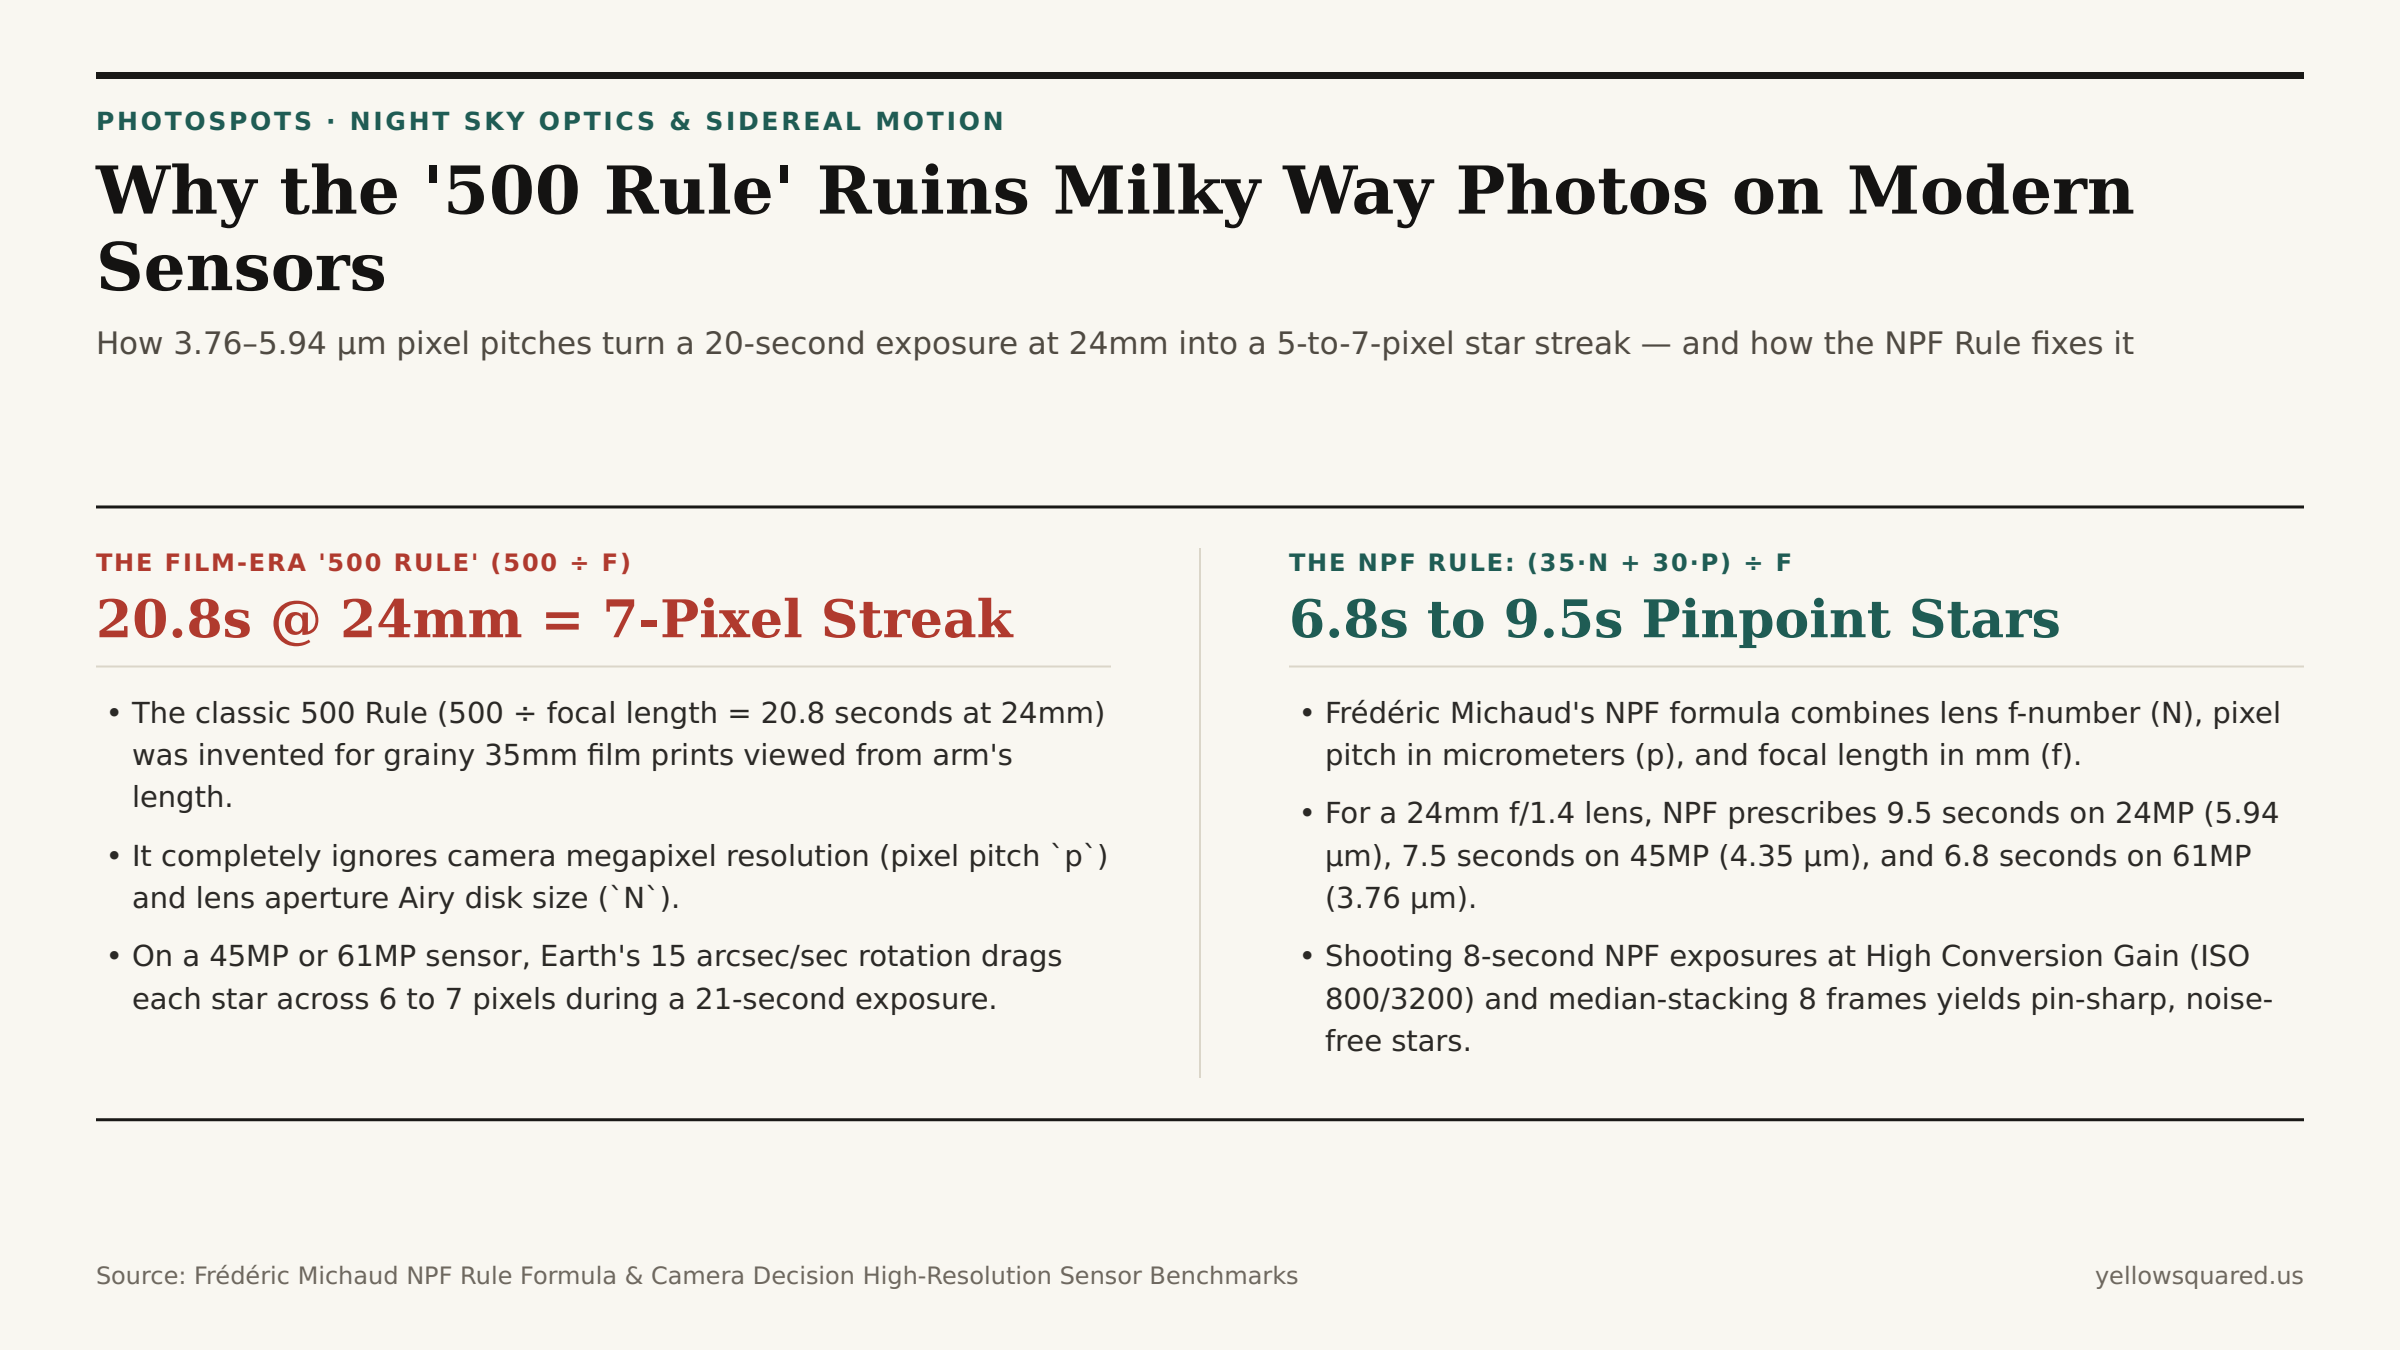
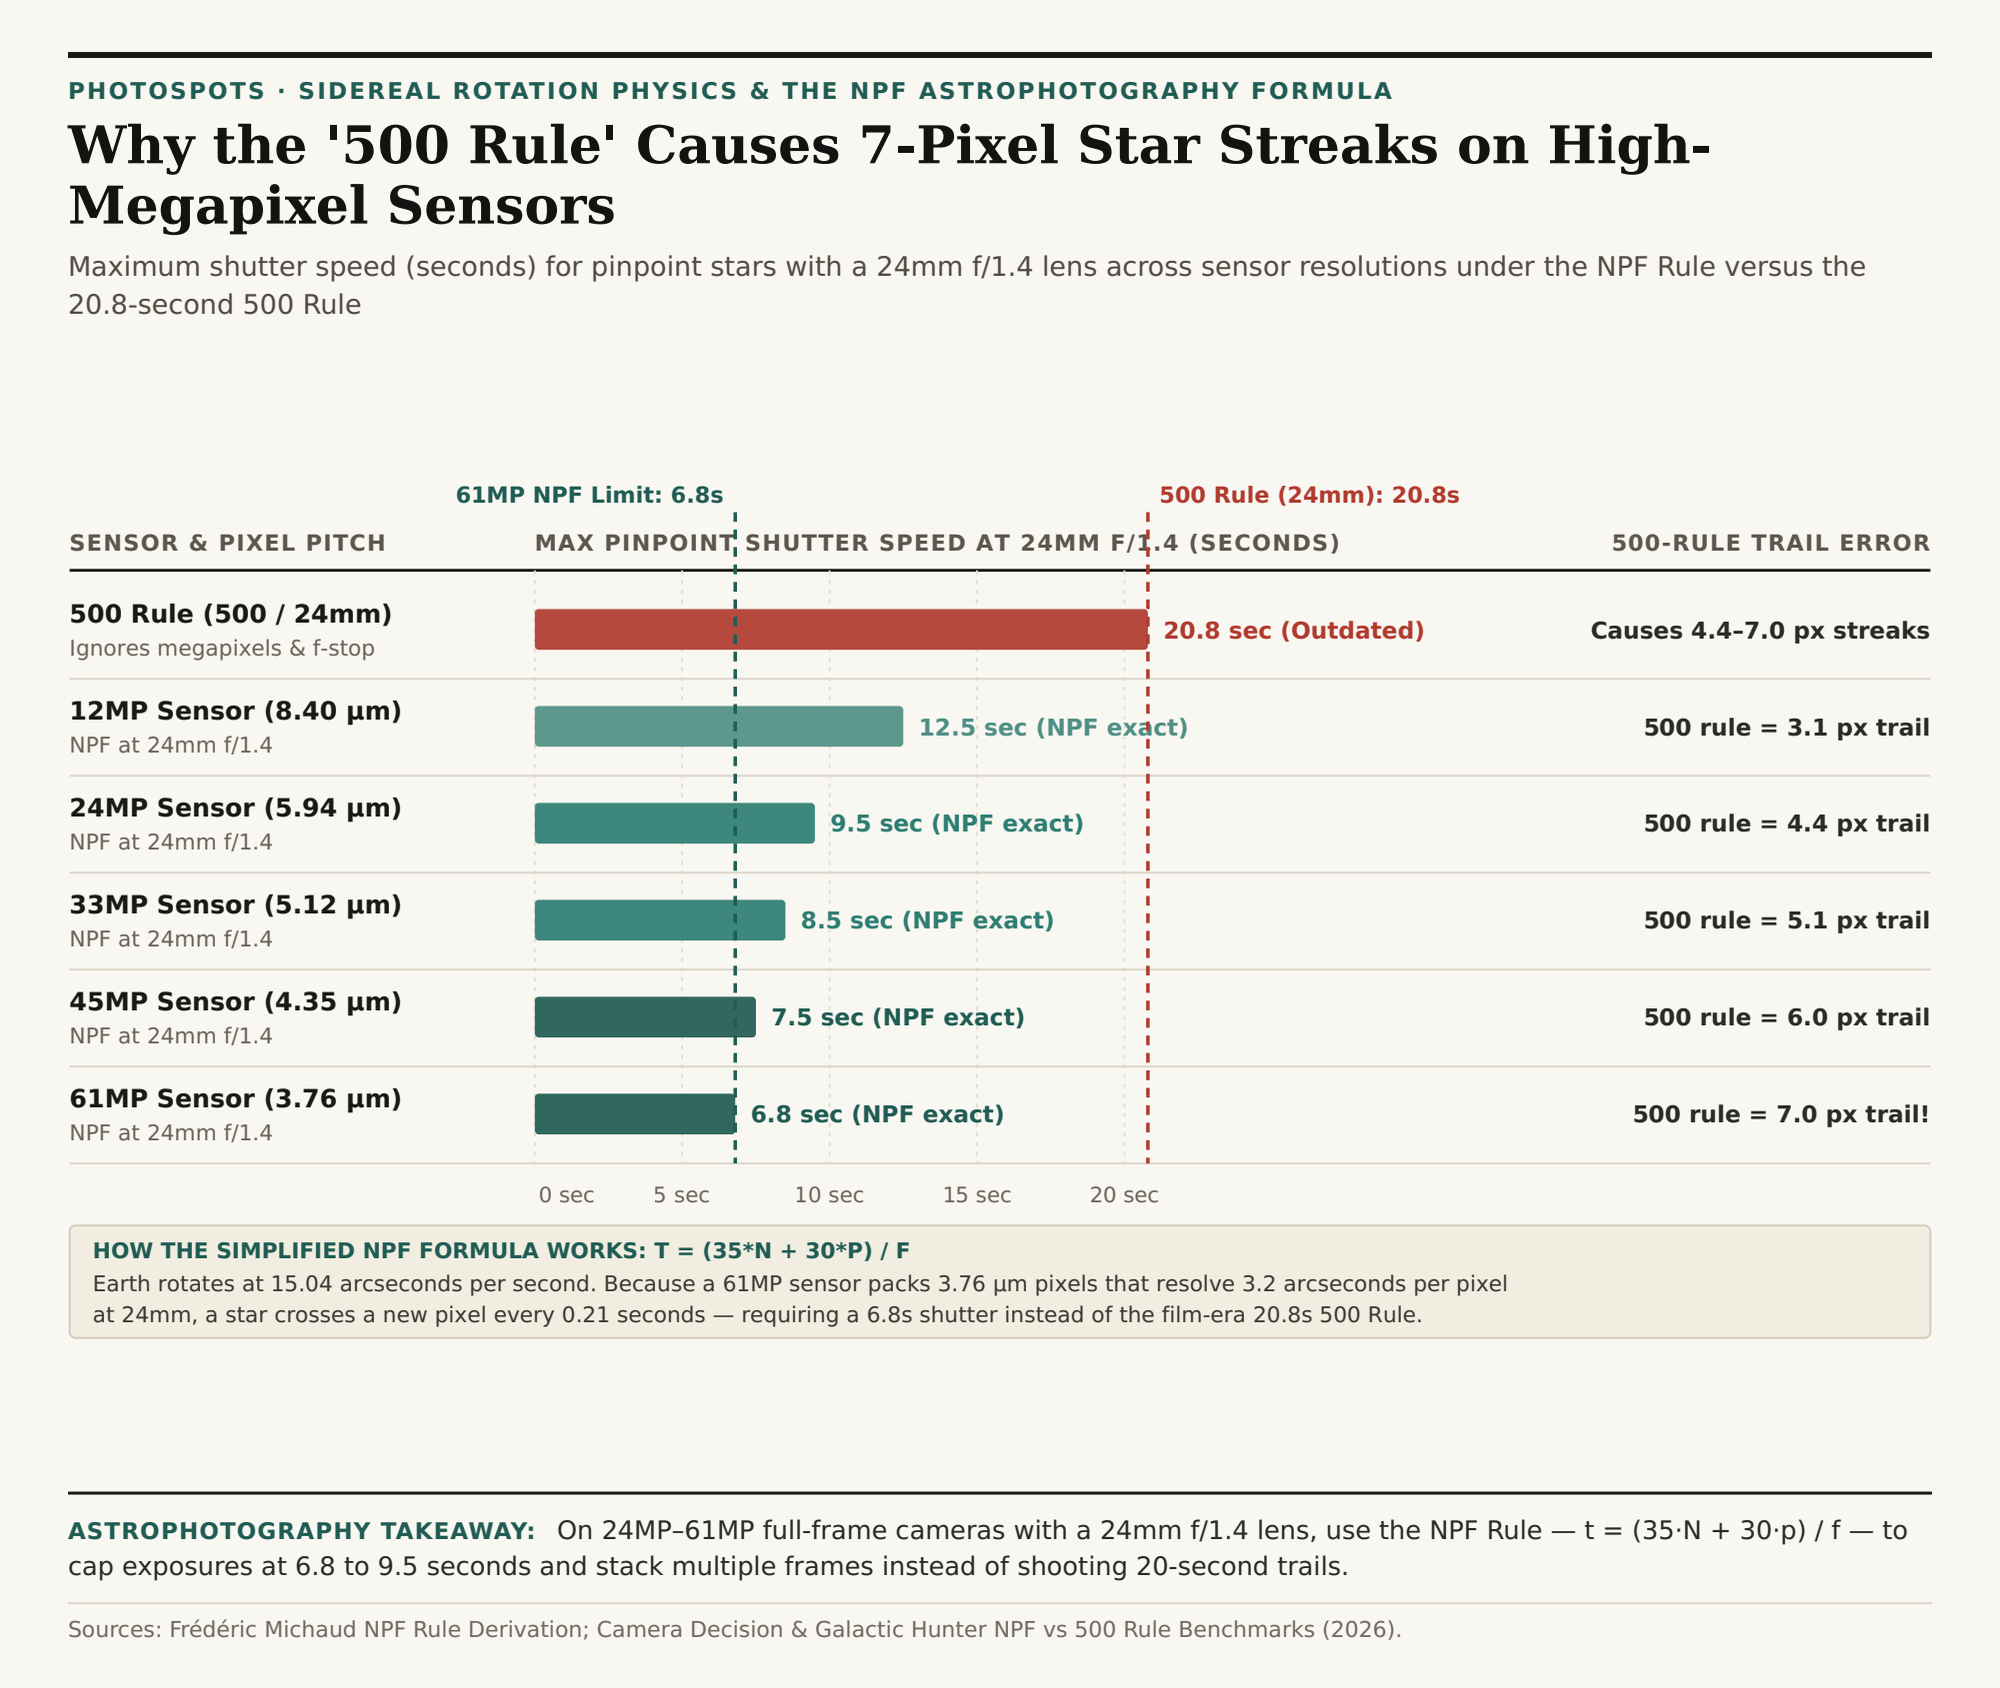
Comparison between the film-era 500 Rule which causes a 7-pixel star streak at 20.8 seconds on a 61MP sensor versus the NPF Rule which keeps stars pinpoint at 6.8 to 9.5 seconds
At 24mm f/1.4, a 20.8-second "500 Rule" exposure drags each equatorial star across 4.4 pixels on a 24MP sensor, 6.0 pixels on a 45MP sensor, and 7.0 pixels on a 61MP sensor.

The Sidereal Math: Why Pixel Pitch (p) and Aperture (N) Matter

As Earth completes one 360-degree sidereal rotation every 23 hours, 56 minutes, and 4 seconds, stars near the celestial equator drift across your stationary camera frame at an angular velocity of 15.04 arcseconds per second. How quickly that angular drift crosses from one pixel into its neighbor depends on three physical variables that Give the NPF Rule its name:

  • N — Lens Aperture (f-number): Because of wave diffraction and optical aberrations, a star is projected onto the sensor as an Airy disk whose diameter scales with f-number (N). A wider aperture (f/1.4) produces a tighter optical spot than f/4, meaning star movement becomes visible sooner across adjacent pixels.
  • p — Sensor Pixel Pitch (in micrometers, µm): A 12-megapixel full-frame sensor (like the Sony a7S III) has large 8.40 µm pixels, whereas a 45MP sensor (Nikon Z8 / Canon EOS R5) has 4.35 µm pixels and a 61MP sensor (Sony a7R V) has tiny 3.76 µm pixels. At 24mm focal length, a single 3.76 µm pixel subtends just 3.23 arcseconds of sky — which means an equatorial star crosses an entire pixel every 0.215 seconds!
  • f — Lens Focal Length (in millimeters): Longer focal lengths magnify angular motion linearly across the sensor plane.

Combining the Rayleigh Airy disk, Bayer demosaicing factor, and angular velocity near the celestial equator yields the standard Simplified NPF Formula (for full-frame or crop sensors alike, since pixel pitch p already accounts for pixel density):

t (seconds) = (35 × N + 30 × p) ÷ f

Horizontal bar chart comparing maximum pinpoint shutter speed in seconds at 24mm f/1.4 under the NPF Rule across 12MP to 61MP sensors against the 20.8-second 500 Rule
Maximum shutter speed (seconds) for pinpoint stars at 24mm f/1.4 across sensor resolutions under the NPF Rule versus the classic 500 Rule. Download the NPF vs. 500 Rule astrophotography table (CSV).

Why Stacking Eight 8-Second NPF Frames Beats One 20-Second Frame

Plug a fast 24mm f/1.4 wide-angle lens into the NPF formula (t = (35 × 1.4 + 30 × p) / 24 = (49 + 30p) / 24) and compare the result against the 20.8-second 500 Rule across modern cameras:

  • 12MP Full Frame (p = 8.40 µm): NPF prescribes 12.5 seconds (500 Rule causes a 3.1-pixel trail).
  • 24MP Full Frame (p = 5.94 µm): NPF prescribes 9.5 seconds (500 Rule causes a 4.4-pixel streak).
  • 45MP Full Frame (p = 4.35 µm): NPF prescribes 7.5 seconds (500 Rule causes a 6.0-pixel streak).
  • 61MP Full Frame (p = 3.76 µm): NPF prescribes 6.8 seconds (500 Rule causes a 7.0-pixel streak).

"Worried that cutting your exposure from 20 seconds to 8 seconds will make your Milky Way noisy? Shoot 6 to 8 consecutive 8-second NPF frames at your sensor's Dual Native HCG ISO (such as ISO 800 or 3200) and align-stack them in software: you collect 3x more total photons than a single 20-second exposure while keeping every star a 2-pixel pinpoint."

Camera Sensor (at 24mm f/1.4) Pixel Pitch (p) 500 Rule Shutter 500 Rule Star Trail NPF Rule Shutter NPF Star Footprint
12MP Full Frame (a7S III) 8.40 µm 20.8 sec 3.1 pixels (Mild oval) 12.5 sec 1.8 px (Pinpoint)
24MP Full Frame (a7 IV / Z6 III) 5.94 µm 20.8 sec 4.4 pixels (Visible trail) 9.5 sec 2.0 px (Pinpoint)
33MP Full Frame (a7 IV) 5.12 µm 20.8 sec 5.1 pixels (Oblong streak) 8.5 sec 2.1 px (Pinpoint)
45MP Full Frame (Z8 / EOS R5) 4.35 µm 20.8 sec 6.0 pixels (Severe streak) 7.5 sec 2.2 px (Pinpoint)
61MP Full Frame (a7R V) 3.76 µm 20.8 sec 7.0 pixels (7px streak!) 6.8 sec 2.3 px (Pinpoint)
26MP APS-C (16mm f/1.4) 3.76 µm 20.8 sec (300: 18.8s) 7.0 pixels (Severe streak) 7.4 sec 2.5 px (Pinpoint)

Planning Moonless Galactic Core Windows

The 300 Rule is a looser field shortcut. On a modern high-resolution sensor, check the NPF estimate or make a test frame if you want tighter stars.

Because the Milky Way core rises in the southeast and arcs across the southern sky between March and October in the Northern Hemisphere, pairing an exact NPF shutter speed with dark-sky moon phase timing ensures maximum contrast on your stacked frames. Plan dark-sky astrophotography shoots in PhotoSpots and download the NPF vs. 500 Rule shutter-speed CSV dataset.

023 / 29

What Is Dual Native ISO?

Some cameras have a second sensor gain mode that can clean up shadows at a higher ISO. The switch point depends on the camera and recording mode.

On a camera with dual conversion gain, the sensor can read pixel charge in two ways. The higher-gain mode may reduce read noise in dim scenes, but it does not collect more light.

That means ISO 800 is not automatically better than ISO 640 on every camera. The switch may happen at a different setting, and the result can change between photo and video modes.

How to use the second gain mode

  1. Look up measurements for your exact camera and recording mode.
  2. If you are close to its second gain step, compare that setting with the ISO just below it.
  3. Protect important highlights. A lower-noise shadow is not useful if bright parts of the image clip.

Think of dual native ISO as a camera-specific option, not a general rule to keep raising ISO. Aperture, shutter speed, and the amount of light on the scene still matter.

For the sensor design behind the term, see Aptina’s DR-Pix white paper.

024 / 29

What Does “Expose to the Right” Mean?

ETTR means making a RAW photo brighter without clipping important highlights. It can help shadows, but it is a choice, not a rule for every shot.

Your camera’s histogram shows how dark or bright the image is. “Expose to the right” means letting the tones sit farther toward the bright end, while keeping the highlights you care about.

A brighter exposure can give the sensor more light to work with. If you later lower the brightness in your RAW editor, the shadows may look cleaner than if you had captured them very dark and lifted them afterward.

How to try it

  1. Shoot RAW if you plan to adjust exposure later.
  2. Adjust shutter speed or aperture to let in more light, then check the highlights.
  3. Stop before important detail clips. The camera histogram is based on its preview, so leave a little room if you are unsure.
  4. Lower exposure in editing to bring the photo back to the brightness you want.

Do not sacrifice a moving subject to get a brighter histogram. Keep the shutter speed you need, and do not clip a bright sky or a face just to follow ETTR. Raising ISO by itself does not collect more light, though it can affect how your camera handles read noise.

For the noise trade-off behind the technique, see this MIT paper on noise-optimal image capture.