YellowSquared  /  Field notes

Notes from the workshop

53 posts, newest first. Choose an app to narrow the feed.

017 / 53

Why Is San Francisco Colder in July Than in October? The Physics of California's Summer Fog Machine

Every July, thousands of visitors step off planes at SFO wearing shorts and t-shirts—and within two hours are standing in a Fisherman's Wharf gift shop buying an emergency fleece jacket as 25 mph gusts of 56°F (13°C) fog howl off the bay. Even though the famous quip "The coldest winter I ever spent was a summer in San Francisco" is an apocryphal misattribution that Mark Twain never actually wrote, the meteorological anomaly behind it is completely real: according to NOAA National Weather Service Bay Area records and U.S. climate normals, San Francisco is significantly colder in July (66.3°F downtown average high; 59°F at Ocean Beach) than in September (70.2°F) or October (69.3°F).

Chart showing Downtown San Francisco average high temperatures rising from 65.5F in June and 66.3F in July to a peak of 70.2F in September and 69.3F in October
Figure 1: Downtown San Francisco monthly average high temperatures (June–October) compared against Sacramento inland thermal-low temperatures. Reproducible dataset: why-is-san-francisco-so-cold-in-july-mark-twain-summer-fog.csv.

1. Paradoxical Thermodynamics: The Hotter Inland California Gets, the Colder SF Gets

Why does San Francisco refrigerate itself right at the height of astronomical summer? The answer is a three-part thermodynamic engine linking the Pacific Ocean, the Coast Ranges, and California's Central Valley:

  1. The 53°F Coastal Upwelling Freezer: In late spring and summer, clockwise winds around the North Pacific High blow southward along the California coast, pushing surface water offshore via Ekman transport and drawing icy deep water (11°C–13°C / 52°F–55°F) to the surface. When moist Pacific air passes over that cold water bezel, its water vapor condenses into a thick deck of advection fog.
  2. The 95°F Central Valley Thermal Vacuum: Eighty miles inland, the sun bakes Sacramento, Redding, and Fresno to 94°F–102°F (34°C–39°C). That scorching inland air expands and rises, creating a deep low-pressure trough known as a thermal low.
  3. The Golden Gate Venturi Funnel: Dense, high-pressure marine air offshore rushes inland to fill the rising Central Valley vacuum. Because the coastal mountains block the marine layer everywhere except the sea-level gap of the Golden Gate (and the San Bruno gap near SFO), a river of 55°F fog blasts directly across San Francisco every July afternoon at 20 to 28 mph.
"San Francisco's summer air conditioner is powered by Sacramento's furnace: the hotter the Central Valley bakes in July, the harder it sucks 54°F ocean fog through the Golden Gate."

2. Why September and October Are San Francisco's True Summer

Once September and October arrive, days grow shorter and the sun's angle drops. As a result, California's inland Central Valley cools down from 94.1°F (July) to 87.9°F (September) and 77.9°F (October).

As the inland furnace cools, the thermal low weakens and the pressure gradient between the ocean and the interior collapses. The afternoon fog pump shuts off, the stratus deck retreats offshore, and occasional light offshore winds warm adiabatically as they descend the coastal hills—giving San Francisco its warmest, sunniest beach days of the year in late September (`70.2°F` mean high) and October (`69.3°F` mean high). The fog that rolls in off the ocean is advection fog, moved by wind rather than formed by ground cooling; for the difference, read radiation fog vs advection fog.

3. San Francisco vs. Inland Central Valley Monthly Normals Table

Compare Downtown San Francisco highs, Sacramento inland highs, and Golden Gate sea-breeze intensity from May through October below (available in why-is-san-francisco-so-cold-in-july-mark-twain-summer-fog.csv):

Month Downtown SF High Sacramento Inland High Inland-Coast Temp Gap Golden Gate Afternoon Wind Microclimate Regime
May 63.8°F (17.7°C) 83.5°F (28.6°C) 19.7°F gradient 18–22 mph westerly Peak cold upwelling onset
July ('No-Sky July') 66.3°F (19.1°C) 94.1°F (34.5°C) 27.8°F max suction! 22–28 mph + 60% fog Peak thermal-low fog pump!
August ('Fogust') 67.6°F (19.8°C) 92.8°F (33.8°C) 25.2°F gradient 20–25 mph stratus Persistent coastal marine layer
September (Warmest!) 70.2°F (21.2°C) 87.9°F (31.1°C) 17.7°F (Weakening) 10–14 mph light breeze Peak 'Indian Summer' sun!
October ('Second Summer') 69.3°F (20.7°C) 77.9°F (25.5°C) 8.6°F (Pump off!) 8–12 mph calm sun +3.0°F warmer than July!

4. Compare Coastal vs. Inland Climate Curves in Eranorms

Even within San Francisco itself, mountain gaps create dramatic street-by-street microclimates: on a July afternoon when Ocean Beach in the Outer Sunset sits in 57°F fog, Mission Dolores—shielded behind the 925-foot Twin Peaks ridge—regularly basks in 68°F–72°F sunshine just four miles east. To compare month-by-month temperature, wind, and sunshine normals across coastal and inland weather stations, Compare historical climate normals in Eranorms.

Verified Primary Sources

  1. NOAA National Weather Service — San Francisco Bay Area (MTR) Climate Records & Marine Layer Sea-Breeze Dynamics (Retrieved 2026-10-31).
  2. Wikipedia / NOAA NCEI Normals — Climate of the United States: Coastal California Summer Upwelling, Advection Fog & September Temperature Maximum (Retrieved 2026-10-31).

018 / 53

Why Doesn't It Rain on the US West Coast in the Summer Compared to the East Coast?

Visitors flying from New York, Atlanta, or Chicago to California or the Pacific Northwest in July are often stunned by two things: nobody carries an umbrella, and there is zero thunder or lightning all summer long. Between June 1 and August 31, New York City averages 12.96 inches of rain and Miami receives 27.15 inches, whereas San Francisco records just 0.18 inches, Los Angeles gets 0.09 inches, and even famously rainy Seattle receives only 2.55 inches. Both coastlines sit beside an ocean at the exact same latitudes—so why is one bone-dry all summer while the other is drenched in tropical thunderstorms?

Chart comparing June-August summer rainfall in Los Angeles (0.09 in), San Francisco (0.18 in), and Seattle (2.55 in) against New York City (12.96 in) and Miami (27.15 in)
Figure 1: Total summer precipitation (June–August 30-year normals) and offshore sea-surface temperatures across five U.S. coastal cities. Reproducible dataset: why-is-the-west-coast-of-the-us-drier-in-summer-than-the-east-coast.csv.

1. Opposite Sides of Two Clockwise Subtropical Highs

In the Northern Hemisphere, semi-permanent subtropical high-pressure systems spin clockwise due to the Coriolis effect. As defined in the NOAA National Weather Service Meteorology Glossary for the North Pacific High and the Bermuda/Azores High, both oceans are dominated by a massive summer high-pressure dome—but the two U.S. coastlines sit on opposite flanks of that clockwise rotation:

  • The U.S. West Coast sits on the Eastern Flank of the North Pacific High: Clockwise flow along the eastern edge of the North Pacific High drives persistent northerly winds from Canada southward down the Washington, Oregon, and California coast, while large-scale air aloft sinks toward the surface (subsidence) and warms adiabatically by compression.
  • The U.S. East Coast sits on the Western Flank of the Bermuda High: Clockwise flow along the western edge of the Bermuda High pumps warm, humid tropical air from the Caribbean and Gulf of Mexico northward up the Eastern Seaboard.
"Every raindrop begins with rising air. On the West Coast, cold 12°C ocean water at the bottom and warm sinking air at the top create an upside-down temperature profile that physically locks summer clouds below 2,000 feet."

2. Cold California Upwelling vs. the 28°C Gulf Stream

Ocean currents amplify this atmospheric split. Along the West Coast, northerly winds pushing southward combine with Earth's rotation (Ekman transport) to push surface water offshore, drawing icy deep-ocean water (12°C–14°C / 53°F–57°F) up to the surface inside the California Current. As shown in San Francisco State University coastal micrometeorology research, while low coastal fog (Advection fog) covers coastal California 60% of summer hours, that cold marine layer is capped at 400–800 meters by hot, sinking air above it.

Because cold, dense air is already at the bottom and warm, buoyant air is already at the top, the atmosphere is statically stable: air parcels cannot rise to form towering cumulonimbus rain clouds. On the East Coast, the Gulf Stream bathes the coastline in 25°C–29°C (77°F–85°F) water, supercharging surface air with heat and water vapor that erupts into afternoon thunderstorms whenever a weak front or sea-breeze boundary passes through.

3. East Coast vs. West Coast Summer Climate Normals Table

Compare summer rainfall, offshore sea-surface temperatures, and governing pressure systems across five U.S. coastal cities below (available in why-is-the-west-coast-of-the-us-drier-in-summer-than-the-east-coast.csv):

U.S. Coastal City Latitude Summer Pressure System Offshore Current & SST June–August Rainfall Atmospheric Stability Mechanism
Los Angeles, CA (West) 34.05° N North Pacific High (East Flank) California Current (17°C) 0.09 in (2.3 mm) Strong subsidence inversion cap
San Francisco, CA (West) 37.77° N North Pacific High (East Flank) Coastal Upwelling (12°C) 0.18 in (4.6 mm) Marine fog capped below 600m
Seattle, WA (West) 47.61° N North Pacific Summer Ridge California Current (13°C) 2.55 in (64.8 mm) Ridge deflects storm track to Alaska
New York City, NY (East) 40.71° N Bermuda High (West Flank) Gulf Stream (25°C) 12.96 in (329 mm) Humid southerly flow + fronts
Miami, FL (East) 25.76° N Bermuda High + Sea Breeze Gulf Stream (29°C) 27.15 in (690 mm) Extreme CAPE + daily storms

4. Explore Month-by-Month Precipitation and Dew Point Normals in Eranorms

Wait until November, and the entire pattern flips: the North Pacific High retreats southward toward Hawaii, allowing the Aleutian Low and Pacific atmospheric rivers to drench Seattle and San Francisco all winter long. To compare 30-year monthly rainfall, dew point, and solar radiation curves across global weather stations, Compare historical climate normals in Eranorms.

Verified Primary Sources

  1. NOAA National Weather Service — Meteorology Glossary: North Pacific High & Seasonal Migration and Bermuda/Azores High (Retrieved 2026-10-31).
  2. Oliphant, Baguskas & Fernandez (2021, SFSU / Theoretical and Applied Climatology) — Impacts of Low Cloud and Fog on Surface Radiation Fluxes for Coastal California (Retrieved 2026-10-31).

019 / 53

Why Does Frost Form on Your Car Windshield When the Air Is 36°F or 38°F?

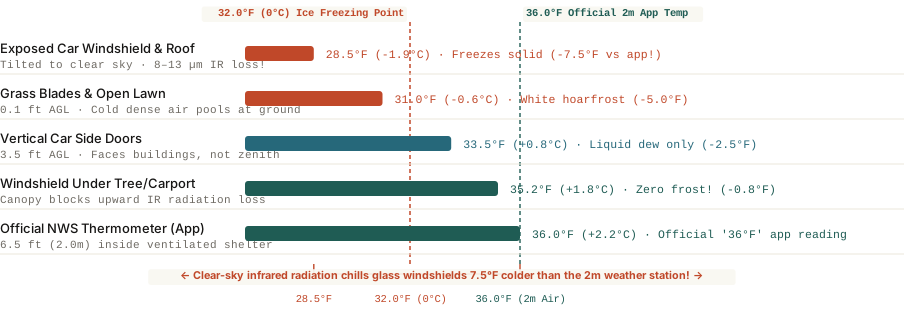
Official weather stations measure air temperature inside a sheltered box 6.5 feet (2 meters) above the ground—while your upward-tilted glass windshield radiates infrared heat (emissivity 0.94) straight into outer space on clear, calm nights and drops to 28.5°F.

Walk out to your driveway at 6:30 AM on a crisp autumn morning, glance at your phone's weather app or your car's dashboard thermometer, and it reads a safe `36°F` (`+2.2°C`)—four full degrees above the `32°F (0°C)` freezing point of water. Yet when you look at your car's windshield and roof, both are coated in a crunchy layer of white crystalline frost that requires five minutes of scraping.

How can water freeze solid onto glass when the air temperature never dropped to `32°F`? According to meteorologists at the National Weather Service (NOAA)—who routinely issue official **Frost Advisories** whenever overnight lows are forecast between **`33°F and 36°F`**—two distinct microclimate physics mechanisms cause your windshield to drop **`5°F to 8°F` colder than the weather station**.

Comparison of actual surface temperatures across car windshields, grass blades, side doors, carports, and the 2-meter weather station shelter at 36 degrees Fahrenheit
Figure 1: Actual temperature (`°F`) across five microclimate surfaces when the official `2-meter` (`6.5 ft`) weather station reads `36.0°F`. Download microclimate dataset: why-do-cars-frost-over-when-air-temperature-is-above-freezing.csv.

Mechanism 1: Blackbody Infrared Radiation Through the 8–13 µm Sky Window

The primary reason your windshield freezes first has nothing to do with the air touching it—it is about **what your windshield is pointing at**. Every object above absolute zero emits thermal infrared radiation (`Stefan-Boltzmann Law`). Silica automotive glass has an exceptionally high thermal infrared emissivity of `~0.94` (behaving almost like an ideal thermal blackbody at longwave wavelengths):

  • The `8–13 µm` Atmospheric Window: On a crystal-clear, cloud-free night with low humidity aloft, Earth's atmosphere is nearly transparent to infrared wavelengths between `8 and 13 micrometers`. An upward-tilted car windshield and flat metal car roof beam their heat straight out into the `-450°F` vacuum of outer space at roughly `70 to 110 Watts per square meter`.
  • Why Air Cannot Warm the Glass Fast Enough: When the wind is calm (`<5 mph`), still air acts as a thermal insulator. Your glass windshield loses heat to the night sky far faster than the surrounding `36°F` air can conduct heat back into it—chilling the glass surface down to `28°F to 30°F`. Once the glass drops below both the dew point and `32°F`, water vapor in the air deposits directly onto the glass as solid ice crystals (`deposition`).
  • Why Vertical Side Windows Frost Less: Notice how your tilted front and rear windshields are frozen solid while the vertical side windows are often clear? The tilted windshield faces the cold zenith of outer space, whereas vertical side doors face warm neighboring houses, fences, and trees that radiate infrared heat back at them!

Your car's thermometer measures the air; frost responds to the temperature of the glass—which is radiating heat straight into outer space.

Mechanism 2: The 6.5-Foot (2-Meter) Weather Station Inversion

The second reason your weather app reads `36°F` during a frost event is **sensor height**. By World Meteorological Organization (WMO) and NOAA standards, official weather station thermometers (`ASOS`) are mounted `2 meters` (`6.5 feet`) above the ground inside a white, louvered wooden or plastic box (`Stevenson screen`) that shields the sensor from radiating heat to the night sky.

  1. Shallow Nocturnal Inversion (`-4°F to -6°F` at the Ground): Because cold air is denser than warm air, on a calm night cold air sinks and pools in the lowest `4 to 12 inches` above the grass and pavement. When it is `36°F` inside a sheltered box at head height (`6.5 feet`), the open grass at ankle height is already **`30°F to 31°F`**.
  2. How to Prevent Windshield Frost Without a Garage: Because windshield frost is driven by upward infrared radiation to the clear zenith sky, simply **parking under the branches of a tree, beside a tall building wall, or placing a thin cloth cover over the glass** blocks the "sky-view factor" and keeps the glass within `1°F` of the `36°F` ambient air—completely frost-free.

To track overnight radiational cooling inversions, 2-meter vs. skin-temperature spreads, and local frost probabilities, you can Analyze atmospheric soundings on Eranorms for your exact station coordinates.

020 / 53

What Is Virga? Why Rain Evaporates in Mid-Air Before Reaching the Ground

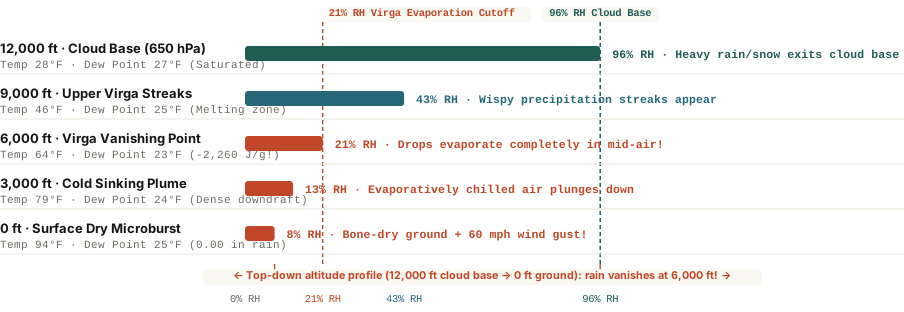
When precipitation falls from a high cloud base (10,000–12,000 ft) into a bone-dry boundary layer, every evaporating gram of water absorbs 2,260 Joules of latent heat—vaporizing the rain mid-air while chilling a dense downdraft that hits the ground as wind.

Step outside on a warm afternoon in Denver, Phoenix, Salt Lake City, or eastern Washington after your phone's weather radar app alerts you that a green blob of "moderate rain" is directly overhead. You look up at the sky: dark, dramatic gray streaks hang down from the undersides of the clouds like jellyfish tentacles, gracefully curving sideways—and then vanishing into thin air. Not a single drop of water hits the pavement.

Those wispy, comma-shaped precipitation shafts that evaporate or sublimate before reaching the earth are called virga (from the Latin word for a twig, rod, or streak). While virga looks harmless—and explains why weather radar apps frequently report "phantom rain"—the thermodynamic energy exchange happening inside a virga shaft can generate dangerous 50 to 75 mph surface wind gusts out of a dry sky.

Top-down vertical altitude profile from 12,000 feet cloud base to 0 feet ground showing relative humidity drop and virga evaporation at 6,000 feet
Figure 1: Top-down altitude profile (`12,000 ft AGL` cloud base down to `0 ft` surface) showing Relative Humidity (`RH %`) and the `6,000 ft` virga vanishing zone. Download atmospheric sounding dataset: what-is-virga-rain-that-evaporates-before-hitting-the-ground.csv.

Why Virga Forms (And Why It Curves Like a Comma)

In humid maritime climates, cloud bases sit low (`2,000 to 4,000 feet` above ground level) and the air underneath is nearly saturated (`70%–90% RH`), allowing raindrops to fall intact to the street. In arid or semi-arid continental climates—or ahead of an approaching warm front—moisture arrives aloft at `10,000 to 15,000 feet` while the lower atmosphere (`boundary layer`) remains desert-dry (`8%–25% RH`, with a `40°F to 65°F` spread between temperature and dew point).

When snow crystals and raindrops fall out of that `12,000-foot` cloud base into the dry sub-cloud layer, two physical effects create the signature hooked shape of virga:

  • Shrinking Terminal Velocity: A large `3 mm` raindrop falls at roughly `8 meters per second` (`18 mph`). As dry air strips water molecules off the outside of the drop, its diameter shrinks below `0.5 mm`, cutting its terminal fall speed to less than `2 meters per second`.
  • Wind-Shear Comma Hooks: Because horizontal wind speed changes with altitude (`vertical wind shear`), those tiny, slow-falling droplets drift horizontally with the lower wind current just before they completely evaporate—curving the bottom of the rain shaft into a graceful comma hook.
  • Why Radar Apps Show 'Phantom Rain': Because NEXRAD Doppler radar beams tilt upward at `0.5°` (and curve higher with Earth's curvature), a radar station 50 miles away is scanning the atmosphere at 5,000 to 8,000 feet aloft—detecting the heavy precipitation inside the upper virga shaft even though `100%` of it evaporates above `4,000 feet`.

The rain inside a virga shaft disappears, but its momentum and cooling energy keep falling all the way to the ground.

The 2,260-Joule Hazard: How Virga Triggers Dry Microbursts

Where does the energy go when millions of tons of falling rain evaporate at `6,000 feet`? Phase changes require enormous thermal energy: melting ice into water absorbs `334 Joules per gram` (latent heat of fusion), and evaporating liquid water into vapor absorbs `2,260 Joules per gram` (latent heat of vaporization).

  1. Rapid Mid-Air Cooling: That latent heat comes directly out of the surrounding sub-cloud air parcel, chilling the air inside the virga shaft by `15°F to 30°F`.
  2. Negative Buoyancy Acceleration: Because cold air is significantly denser than the hot `94°F` ambient air around it, the chilled parcel plunges downward like an invisible lead weight.
  3. The Dry Microburst Outflow: When that sinking column of cooled air slams into the ground, it spreads out horizontally in all directions as a dry microburst—producing sudden 50 to 75 mph straight-line wind gusts and blowing dust rings without a single drop of rain reaching the surface.

To inspect real-time and historical Skew-T atmospheric profiles, sub-cloud dew-point depressions, and inverted-V microburst soundings, you can Analyze atmospheric soundings on Eranorms across global radiosonde stations.

021 / 53

Why Is Relative Humidity Higher at Night Than During the Day?

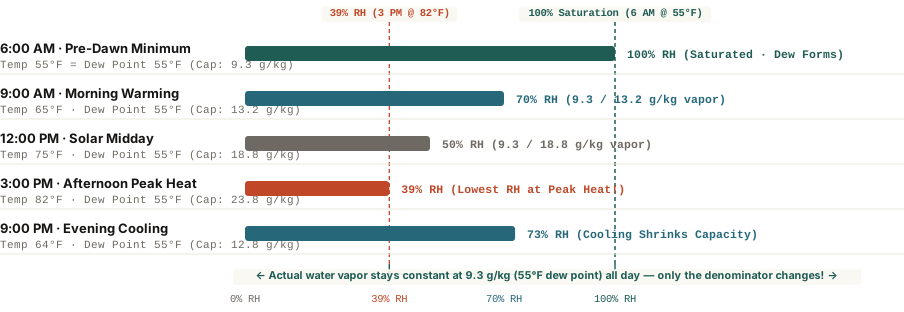
Even when absolute water vapor stays completely flat at 9.3 grams per kilogram of air (a constant 55°F dew point), cooling the air from 82°F at 3:00 PM down to 55°F at 6:00 AM shrinks saturation capacity by 61%—driving relative humidity from 39% to 100%.

Open any weather app at 6:00 AM on a clear summer morning and the humidity readout looks alarming: 92% to 100% Relative Humidity. Step outside six hours later at 3:00 PM when the afternoon sun is blazing at `82°F (27.8°C)`, check the exact same weather app, and the Relative Humidity has plummeted to 39%—only to climb right back past 75% after sunset.

Did a massive wave of water vapor roll into your neighborhood overnight and evaporate at lunchtime? Not at all. In a stable air mass without an approaching weather front, the actual mass of water vapor floating in every kilogram of air barely changes between dawn and mid-afternoon. Understanding why Relative Humidity (`RH %`) is an upside-down mirror of the daily temperature curve—and why meteorologists track the Dew Point instead—transforms how you read a weather forecast.

Diurnal relative humidity percentage swing from 6 AM to 9 PM at a constant 55 degrees Fahrenheit dew point
Figure 1: Diurnal Relative Humidity (`RH %`) across five times of day when actual water vapor stays constant at `9.3 g/kg` (`55°F` dew point). Download thermodynamic dataset: why-is-relative-humidity-higher-at-night-than-day.csv.

The Thermodynamics of the 'Expanding Bucket': Clausius-Clapeyron

According to the National Weather Service (NOAA), Relative Humidity does not measure how much water is in the air; it measures how full the air's temperature-dependent 'bucket' is at that exact moment:

`Relative Humidity (%) = (Actual Water Vapor Mixing Ratio ÷ Saturation Mixing Ratio at Current Temp) × 100`

Governed by the Clausius-Clapeyron relation, the saturation vapor pressure (the denominator of that fraction) increases exponentially with temperature—roughly doubling for every `20°F` (`11°C`) increase in air temperature. Follow a single parcel of air containing exactly `9.3 grams` of water vapor per kilogram of dry air (a constant `55°F / 12.8°C` dew point) across a clear 24-hour cycle:

  • 6:00 AM (`55°F / 12.8°C` — Pre-Dawn Minimum): At `55°F`, a kilogram of air can hold a maximum of `9.3 g` of water vapor before condensation begins. Because the air actually holds `9.3 g/kg`, the bucket is `9.3 ÷ 9.3 = 100% full` (`100% RH`), condensing excess moisture onto grass blades as morning dew.
  • 12:00 PM (`75°F / 23.9°C` — Solar Midday): Solar heating warms the air by `20°F`, doubling its saturation capacity to `18.8 g/kg`. With the exact same `9.3 g/kg` of water vapor inside, Relative Humidity drops in half to `9.3 ÷ 18.8 = 50% RH`.
  • 3:00 PM (`82°F / 27.8°C` — Afternoon Peak): At `82°F`, the air's capacity expands to `23.8 g/kg`, pushing Relative Humidity down to its daily minimum of `9.3 ÷ 23.8 = 39% RH`.
  • 9:00 PM (`64°F / 17.8°C` — Radiational Cooling): Once the sun sets and the ground radiates infrared heat into space, the boundary layer cools back toward `64°F`, shrinking the bucket to `12.8 g/kg` and sending Relative Humidity climbing back to `73% RH`.

Relative humidity goes up at night not because the air gains water, but because cooling air loses its capacity to hold water vapor in gas form.

Why You Should Check the Dew Point Instead of Relative Humidity

Because Relative Humidity changes every time the thermometer moves, a winter morning at `35°F` with `95% RH` contains very little water vapor and feels bone-dry indoors, whereas a `90°F` summer afternoon at `55% RH` (`72°F` dew point) feels oppressive because sweat cannot evaporate rapidly off your skin. Use NOAA's absolute Dew Point scale to judge how the air actually feels:

  1. Dew Point Below `55°F` (`<12.8°C`): Crisp, dry, and comfortable day and night—even if dawn Relative Humidity hits `100%`.
  2. Dew Point `60°F–64°F` (`15.6°C–17.8°C`): Noticeably sticky during outdoor exercise.
  3. Dew Point `65°F–70°F+` (`18.3°C–21.1°C+`): Oppressive, tropical mugginess where overnight temperatures cannot cool below `68°F`.

To inspect diurnal temperature-dewpoint spreads, boundary-layer inversion curves, and historical climate normals across global stations, you can Analyze atmospheric soundings on Eranorms for any season of the year.

022 / 53

What Is Virga? Why Rain Evaporates Before Reaching the Ground

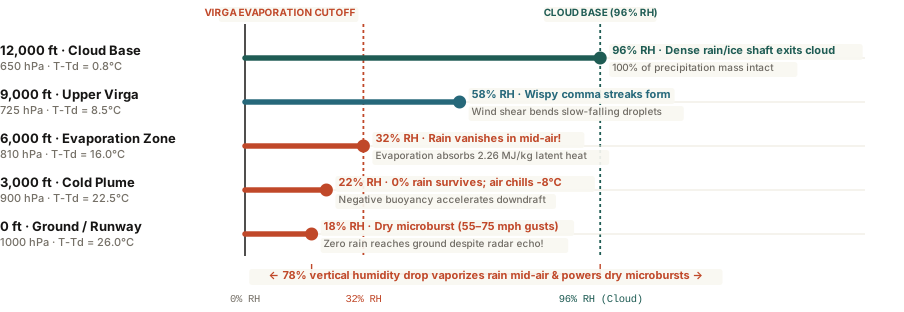
Virga forms when precipitation falls out of a high cloud base (600–700 hPa) into an arid sub-cloud boundary layer—vaporizing in mid-air while absorbing 2.26 MJ/kg of latent heat that can accelerate dangerous 60-mph dry microburst downdrafts.

Step outside on an arid afternoon in Denver, Phoenix, or Salt Lake City, look toward a darkening deck of mid-level clouds, and you will often spot dramatic, jellyfish-like curtains of rain or snow trailing downward from the cloud base—only to taper into feathery wisps and vanish thousands of feet above the ground. Check your phone's weather radar at the exact same moment, and the map may show a bright green blob of precipitation directly over your neighborhood while the sidewalk beneath your shoes remains bone-dry.

Meteorologists call these evaporating precipitation shafts virga (from the Latin word for a rod, twig, or streak). While virga often looks peaceful from a distance—especially at sunset when low-angle light turns the hanging ice crystals crimson and gold—the thermodynamic process happening inside that vanishing rain shaft is one of the primary engines of severe low-altitude wind shear.

Vertical atmospheric profile of virga from 12,000 ft cloud base to dry surface microburst outflow
Figure 1: Vertical profile of relative humidity, dew-point depression (`T - Td`), and hydrometeor survival from a 12,000-foot (`650 hPa`) cloud base down to the surface (`1000 hPa`). Download atmospheric profile dataset: what-is-virga-rain-evaporating-before-hitting-ground.csv.

The Physics: Inverted-V Soundings and Why Virga Bends Like a Comma

Virga requires a two-layer atmospheric sandwich: a moist, saturated mid-tropospheric cloud deck aloft (`500 to 700 hPa`, or roughly 10,000 to 16,000 feet above ground) sitting atop a deep, arid sub-cloud boundary layer where the dew-point depression (`T - Td`) exceeds 15°C to 25°C (`27°F to 45°F`). On a skew-T log-P thermodynamic diagram, this setup traces a classic "Inverted-V" sounding profile because the temperature line and dew-point line spread wide apart near the ground and pinch together into an upside-down V at the cloud base.

Why do virga streaks curve into graceful comma hooks instead of hanging straight down? As raindrops or snow crystals fall into dry air and shrink by evaporation, their terminal fall velocity drops dramatically (a `2 mm` raindrop falls at `6.5 m/s`, whereas a shrunken `0.2 mm` droplet drifts downward at less than `0.7 m/s`). Because horizontal wind speed usually changes with altitude, those slow-drifting micro-droplets near the bottom tip of the virga trail get blown sideways by wind shear, curving the shaft into a comma tail before it vaporizes completely.

Evaporation does not destroy energy; every gram of rain that vanishes in mid-air extracts 2,260 joules of heat from the surrounding air, turning a warm breeze into a plunging cold downdraft.

How Virga Triggers 65-MPH "Dry Microbursts" and Phantom Radar Echoes

Two practical hazards accompany strong virga events:

  • Dry Microburst Wind Shear: Phase changes require massive amounts of thermal energy. Evaporating liquid water absorbs 2.26 megajoules per kilogram (`2,260 J/g`) of latent heat (and sublimating ice crystals absorb even more: 2.83 MJ/kg). That rapid cooling chills the air parcel inside the virga shaft by `5°C to 10°C` relative to the warm ambient air outside. Because cold air is denser than warm air, the chilled parcel plunges toward the ground like a dropped bowling ball—hitting the surface and fanning out radially as a 50-to-75 mph dry microburst even when zero rain reaches the ground.
  • Phantom Radar Echoes: Weather radar beams angle upward at `0.5°` to `1.5°` as they travel away from the radar dome. At 50 miles from the radar station, the beam scans the atmosphere at 4,000 to 8,000 feet above the ground—detecting the dense precipitation inside the upper virga shaft long before it evaporates in the dry air below.

To inspect live Inverted-V sub-cloud dew-point depressions and downdraft convective available potential energy (`DCAPE`), you can Analyze atmospheric soundings on Eranorms for any upper-air station or forecast grid.

023 / 53

How Far Away Is Lightning? The 5-Second Flash-to-Bang Rule Explained

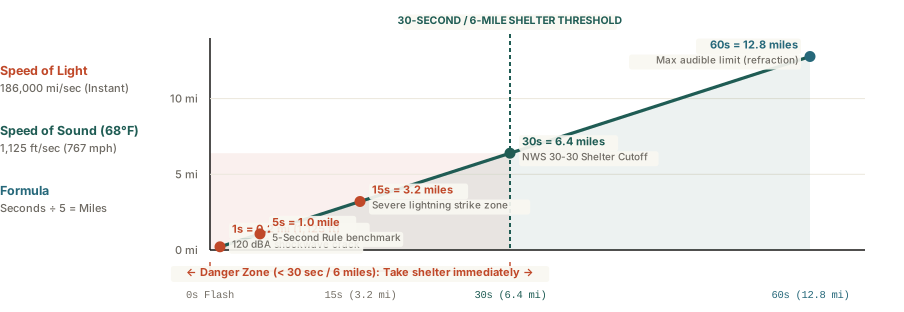
Because light travels at 186,000 miles per second while thunder propagates as a sonic shockwave at ~1,125 feet per second (767 mph at 68°F), counting 5 seconds between a lightning flash and thunder equals 1 mile of strike distance.

When a summer cumulonimbus anvil darkens the horizon and a jagged bolt of cloud-to-ground lightning illuminates the sky, everyone instinctively starts counting until the thunder arrives. Yet one of the most persistent outdoor myths holds that each second you count equals one mile of distance. In reality, equating one second to one mile overestimates your safety margin by a factor of five—leading hikers, boaters, and golfers to believe a storm is five miles away when the bolt just struck a mile down the trail.

Understanding the exact thermodynamic speed of sound in warm boundary-layer air—and why thunderstorms more than 12 to 15 miles away produce silent flashes often mislabeled as "heat lightning"—gives you an instant, reliable field gauge for severe weather safety.

Lightning distance in miles by flash-to-bang delay in seconds and the 30-30 safety rule
Figure 1: Horizontal lightning strike distance (miles) by flash-to-bang acoustic arrival delay (seconds) at 68°F (20°C), highlighting the 30-second (6-mile) National Weather Service shelter cutoff. Download acoustic table: what-causes-thunder-and-how-far-away-is-lightning.csv.

50,000°F Plasma and the 5-Second-Per-Mile Formula

A cloud-to-ground lightning return stroke superheats a narrow channel of air (roughly an inch in diameter) to 50,000°F (27,700°C) in less than 30 microseconds—five times hotter than the surface of the sun. That sudden thermal spike increases air pressure inside the channel to 10 to 100 times normal atmospheric pressure, driving an outward supersonic shockwave at Mach 10. Within the first 10 to 30 feet, that shockwave decays into an ordinary acoustic sound wave that we hear as thunder.

Because the optical flash travels at the speed of light (186,282 miles per second), it reaches your eyes instantaneously. Sound, however, travels through 68°F (20°C) air at just 1,125 feet per second (343 meters per second, or 767 mph). Since one statute mile contains 5,280 feet:

  • In Miles (Divide Seconds by 5): It takes 4.69 seconds (rounded to 5 seconds) for thunder to travel 1 mile. A 10-second delay equals 2 miles; a 15-second delay equals 3 miles.
  • In Kilometers (Divide Seconds by 3): At 343 meters per second, thunder travels 1 kilometer in 2.91 seconds (rounded to 3 seconds).

There is no such thing as "heat lightning." Silent summer flashes are simply ordinary thunderstorms located more than 12 to 15 miles away whose thunder has refracted upward over your head.

The 30-30 Safety Rule and Why Thunder Vanishes Past 15 Miles

Lightning bolts frequently travel horizontally through the upper anvil of a thunderstorm before striking the ground—so-called "bolts from the blue"—up to 6 to 10 miles away from the rain core. For that reason, the NOAA National Weather Service and OSHA enforce the 30-30 Rule: if your flash-to-bang count is 30 seconds or less (<= 6 miles), you are already inside the active strike zone and must enter a substantial building or hard-topped vehicle immediately, waiting 30 minutes after the final clap of thunder before resuming outdoor activity.

Why can you see lightning from 40 miles away at night but rarely hear thunder beyond 12 to 15 miles? Because sound travels faster in warm air than in cold air. Since atmospheric temperature normally decreases with altitude, the upper part of a sound wave slows down while the lower part near the warm ground speeds up—bending (refracting) the sound wave upward into the sky so it passes miles above the head of a distant observer. You can Analyze atmospheric soundings on Eranorms to inspect boundary-layer temperature lapse rates and convective instability profiles in real time.

024 / 53

What Is a Bomb Cyclone? Explosive Cyclogenesis Explained

A mid-latitude storm becomes a bomb cyclone when its central atmospheric pressure drops by at least 24 millibars in 24 hours—triggering hurricane-force gusts, coastal storm surges, and rapid barometric plunges.

When powerful winter storms sweep along the North American coastline, meteorologists frequently describe them as "bomb cyclones" or warn of impending "bombogenesis." To the general public, the terminology sounds sensationalized—like an exaggerated modern headline designed for social media engagement. In atmospheric physics, however, a bomb cyclone is a precisely defined mathematical classification that has guided storm forecasting for nearly half a century.

Coined in a landmark 1980 paper by MIT meteorologists Fred Sanders and John Gyakum, explosive cyclogenesis describes an extratropical low-pressure system whose barometric pressure drops with astonishing rapidity. When atmospheric column weight collapses this quickly, the surrounding atmosphere rushes inward to fill the void, generating destructive hurricane-force wind gusts, catastrophic coastal flooding, and violent snowfall rates.

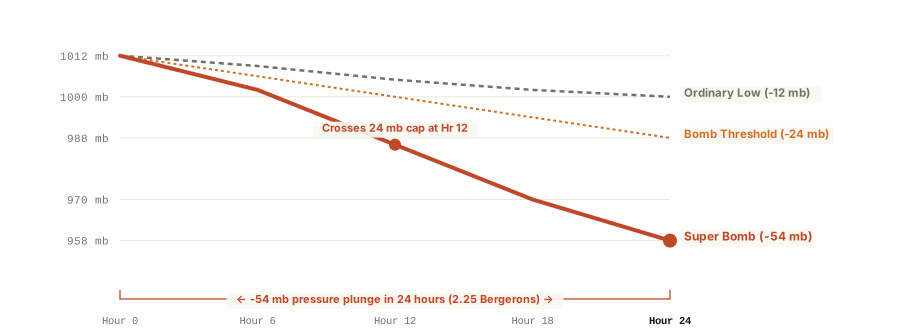
Bomb cyclone 24-hour barometric pressure plunge compared against Bergeron threshold
Figure 1: Twenty-four-hour barometric pressure decline of an explosive bomb cyclone (-54 hPa) compared against the Sanders 24-mb threshold and an ordinary extratropical low. Verified benchmark data: what-is-a-bomb-cyclone-weather.csv.

The Bergeron Rate: Defining Explosive Deepening

In mid-latitude meteorology, an extratropical cyclone is classified as a bomb when its central sea-level pressure deepens by at least 24 millibars (hPa) over a 24-hour period. Because planetary vorticity varies with latitude, Sanders and Gyakum established a normalized metric known as the Bergeron, named in honor of Swedish meteorology pioneer Tor Bergeron:

One Bergeron represents a central pressure fall of 24 millibars in 24 hours normalized to 60 degrees latitude: B = (ΔP / 24) × (sin 60° / sin φ).

At 60° North (near Anchorage or Oslo), a storm requires the standard 24 mb drop in 24 hours to equal 1.0 Bergeron. At 40° North (near New York City or Madrid), the planetary spin is weaker, requiring an 17.8 mb drop in 24 hours to qualify as explosive cyclogenesis. Modern super-bombs frequently exceed 2.0 Bergerons, dropping 40 to 55+ millibars in a single day as they encounter warm Gulf Stream or Kuroshio ocean currents.

Atmospheric Dynamics: How the Jet Stream Fuels the Plunge

Unlike tropical hurricanes, which extract thermal energy entirely from warm ocean waters through latent heat release, bomb cyclones derive their power from baroclinic instability—the collision of radically different air masses.

  • Vigorous Jet Streak Divergence: Bomb cyclones occur when a potent upper-level disturbance encounters the left-exit region of a 160+ knot jet stream. High aloft, air diverges rapidly, creating a powerful vacuum that evacuates air molecules from the column faster than low-level winds can converge to replenish them.
  • Extreme Thermal Contrasts: As freezing continental Arctic air spills off the eastern seaboard and clashes with the warm, moisture-rich Gulf Stream, temperature gradients exceeding 35°F across 100 miles supercharge baroclinic energy conversion.
  • Sensory Impact on Barometers: During a bomb cyclone, home aneroid barometers and smartphone pressure sensors show continuous, steep declines, often plunging 2 to 3 millibars per hour—a rate that frequently triggers ear-popping sensations among coastal residents.

Understanding barometric deepening rates helps emergency planners anticipate sudden coastal surges and structural wind hazards hours before precipitation begins. You can Analyze atmospheric soundings on Eranorms to inspect thermodynamic profiles and jet stream wind structures during major winter storms.