YellowSquared  /  Field notes

Notes from the workshop

53 posts, newest first. Choose an app to narrow the feed.

025 / 53

What Is a Heat Dome? How It Traps Extreme Heat

A heat dome is not simply hot southern air blowing north; it is a persistent, upper-tropospheric high-pressure ridge (an omega block) that acts like a pressure cooker lid, forcing sinking air to compress and heat adiabatically while cloudless skies bake parched ground below. Sinking subsidence air warms at the dry adiabatic lapse rate of roughly 9.8°C per kilometer, creating a dense inversion cap at 850 hPa that traps surface heat, pollutants, and humidity for weeks.
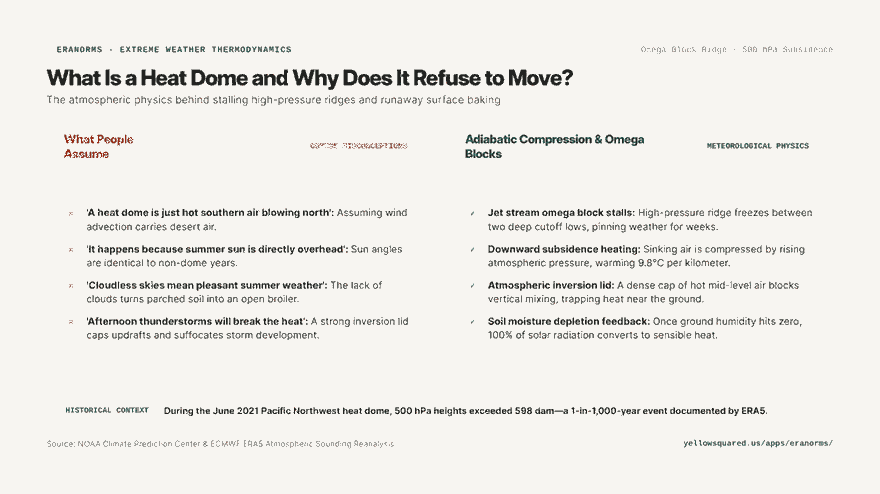
Hook card contrasting common summer heat myths against the thermodynamics of adiabatic compression and omega blocks.
The thermodynamics of a heat dome: jet stream stalling, subsidence compression, and soil desiccation feedback loops.

When extreme heat waves break all-time records by 5°C to 10°C—such as the catastrophic June 2021 Pacific Northwest heat dome that drove Portland to 116°F (46.7°C) and Lytton, British Columbia to an unprecedented 121°F (49.6°C)—the responsible meteorological engine is almost always an amplified 500 hPa anticyclone. Atmospheric reanalysis datasets from the European Centre for Medium-Range Weather Forecasts (ECMWF) show that these events push mid-tropospheric heights past 598 decameters (dam), a statistical 1-in-1,000-year recurrence value.

A heat dome is fueled from the top down; the atmosphere compresses itself, turning sinking air into a furnace before it ever touches the earth.
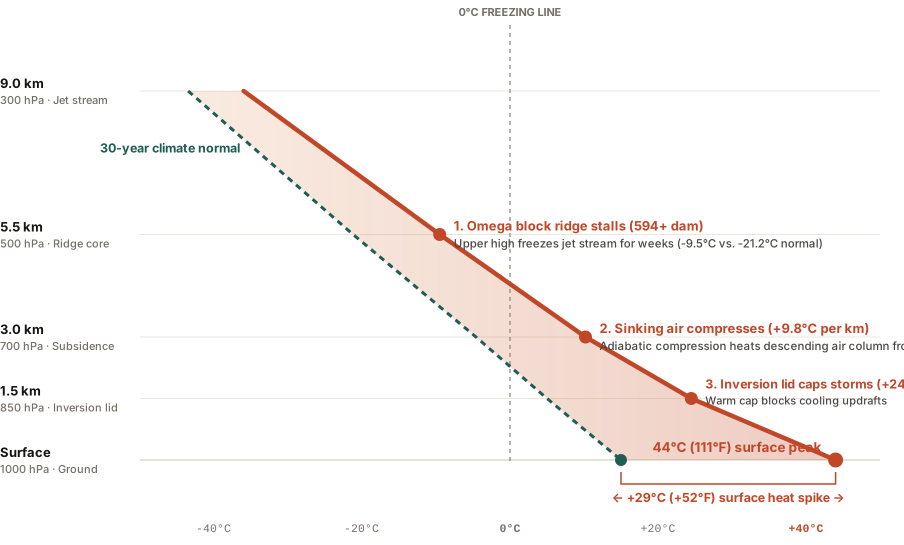
Atmospheric sounding profile comparing a standard climate normal sounding against a severe heat dome sounding from surface to 9 kilometers.
Figure 1: Atmospheric temperature sounding profile contrasting historical climate normal temperatures against a severe heat dome event from ground level to 9 km altitude. Primary data verified from NOAA Climate Prediction Center and ECMWF ERA5 reanalysis soundings. Download raw profile metrics: what-is-a-heat-dome-weather-phenomenon.csv.

The 4-Stage Engine: How Heat Domes Form and Persist

Meteorologists identify four interconnected physical mechanisms that lock a heat dome in place:

  1. The Jet Stream Omega Block: A high-amplitude Rossby wave bends the polar jet stream into a shape resembling the Greek letter Ω (omega). The central ridge of high pressure stalls between two flanking cutoff low-pressure systems, freezing the weather pattern in place for 7 to 21 days.
  2. Subsidence and Adiabatic Compression: High in the troposphere (300 to 500 hPa), converging winds force dense air downward. As this air sinks into higher atmospheric pressure near the surface, it compresses rapidly. This compression heats the air without any external heat source at the dry adiabatic lapse rate of ~9.8°C per 1,000 meters of descent.
  3. The 850 hPa Inversion Lid: This sinking layer creates a pronounced temperature inversion between 1.0 km and 2.5 km altitude. Warm air sits above cooler boundary air, forming an impenetrable cap that prevents vertical convection. Potential storm clouds are suffocated before they can build, blocking any rain from cooling the surface.
  4. Soil Moisture Depletion Feedback: Under cloudless skies, intense solar radiation bakes the topsoil. Once soil moisture evaporates completely, latent heat cooling drops to zero. 100% of incoming solar energy converts directly into sensible surface heat, driving ground temperatures past 120°F (49°C).

Sounding Comparison: Normal Summer vs. Heat Dome

Altitude Level Typical Summer Temp Heat Dome Temp Thermal Anomaly Role in Heat Dome
300 hPa (9.0 km) -43.5°C (-46°F) -36.0°C (-33°F) +7.5°C Omega ridge stalls jet stream westerlies
500 hPa (5.5 km) -21.2°C (-6°F) -9.5°C (+15°F) +11.7°C Geopotential height peak (>594 dam)
700 hPa (3.0 km) -4.6°C (+24°F) +10.2°C (+50°F) +14.8°C Strongest adiabatic compression heating
850 hPa (1.5 km) +5.0°C (+41°F) +24.5°C (+76°F) +19.5°C Inversion cap suffocates thunderstorm updrafts
Surface (0.0 km) +15.0°C (+59°F) +44.0°C (111°F) +29.0°C Departure Dry soil sensible heat spike

How to Survive a Stalled Heat Dome Event

  • Nighttime temperatures are the primary health hazard: In a heat dome, sinking air traps surface heat overnight, keeping minimum temperatures above 80°F (27°C); without nighttime physiological relief, cardiovascular stress multiplies.
  • Hydrate before outdoor exposure: High vapor pressure deficits evaporate sweat almost instantly, leading to rapid dehydration before thirst cues trigger.
  • Track local historical climate anomalies: Compare current temperature departures against 30-year station normals and weather soundings with Eranorms.
026 / 53

Why Is the Desert So Cold at Night?

Deserts become freezing cold at night because their bone-dry air completely lacks the natural greenhouse "vapor blanket" that keeps humid regions warm, allowing up to 90 percent of daytime ground heat to radiate directly out into space after sunset. Paired with the extremely low specific heat capacity of dry quartz sand — which absorbs heat rapidly at noon but loses it just as quickly by midnight — arid basins like Death Valley routinely experience brutal 35°F to 45°F diurnal temperature swings between daytime scorching heat and nighttime shivering cold.

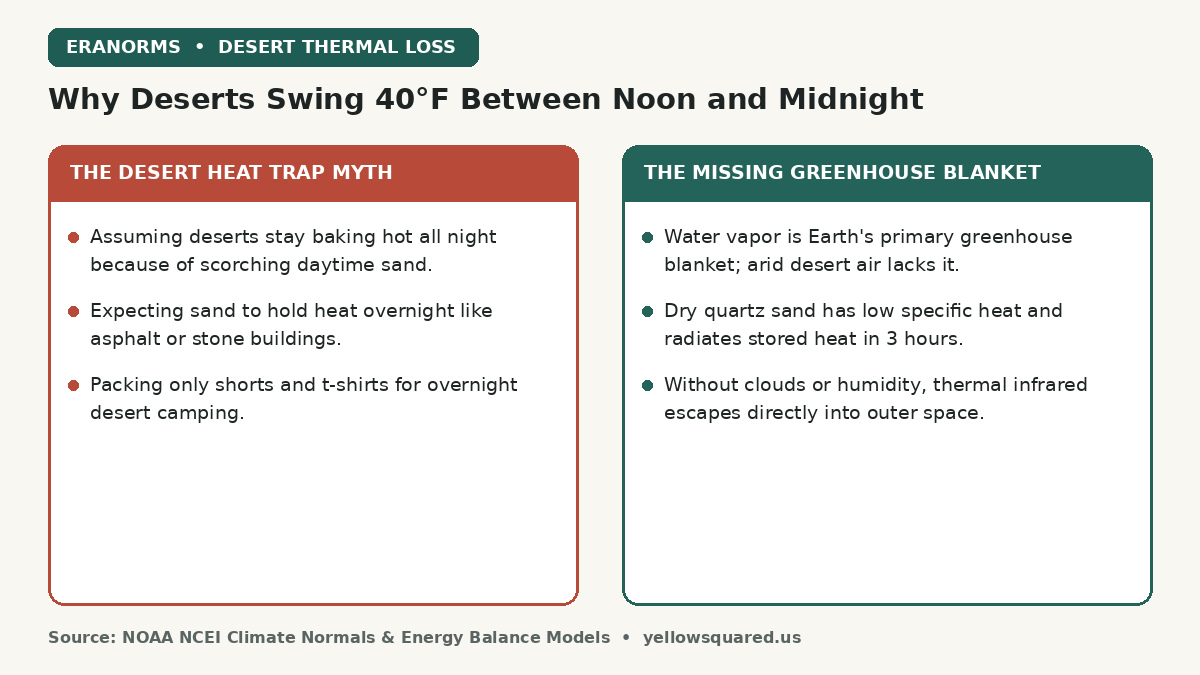
Comparison card contrasting the desert heat trap myth against the missing greenhouse vapor blanket that causes 40 degree daily temperature swings.
Why bone-dry air and low specific heat allow desert heat to escape directly into space after sunset.

Every year, first-time visitors to the American Southwest, Sahara, or Atacama desert pack lightweight summer clothing, expecting the desert to stay sweltering around the clock. By 2:00 AM, they find themselves shivering in 42°F cold, wondering how a landscape that measured 105°F at 3:00 PM could chill so violently. The secret lies not in the soil, but in the invisible humidity of the atmosphere overhead.

Water vapor is Earth's primary greenhouse gas; when relative humidity drops below 15 percent, the planet's atmospheric thermal blanket vanishes.

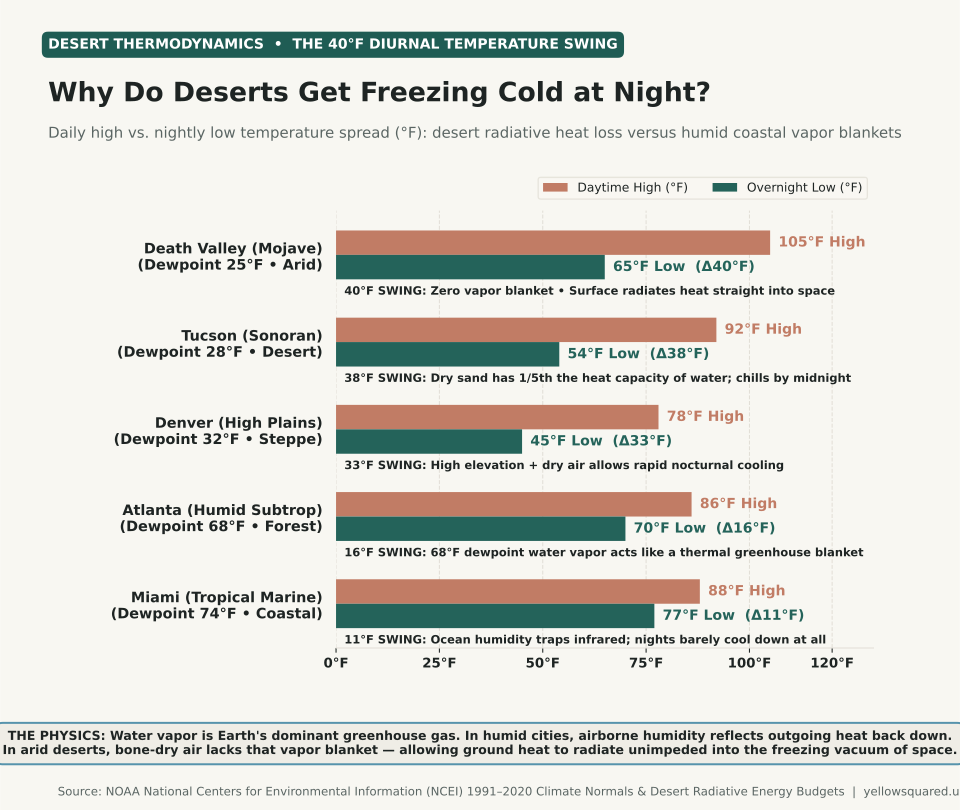
Horizontal bar chart showing daytime high versus nighttime low temperatures across five climates: Death Valley with a 40 degree swing, Tucson with a 38 degree swing, Denver with a 33 degree swing, Atlanta with a 16 degree swing, and Miami with an 11 degree swing.
Figure 1: Diurnal temperature range (daily high vs. overnight low) across desert, steppe, and humid maritime climates. Data compiled from NOAA NCEI 1991–2020 Climate Normals. Download raw data: why-is-the-desert-so-cold-at-night.csv.

The Thermodynamics of the Missing Vapor Blanket

In atmospheric physics, water vapor accounts for roughly 60 percent of Earth's natural greenhouse warming. In a humid coastal city like Miami or Houston, dewpoints hover between 70°F and 76°F. The air column contains up to 20 to 25 grams of water vapor per cubic meter, which absorbs outgoing thermal infrared radiation (λ ∼ 8 to 14 µm) emitted by the cooling ground and re-radiates it back downward, keeping nighttime temperatures locked in the mid-70s.

In an arid desert basin, daytime relative humidity often plummets to 5 to 12 percent with dewpoints well below freezing. The atmosphere overhead contains virtually zero precipitable water vapor. Once the sun dips below the horizon, there is no thermal blanket to reflect longwave infrared radiation back to Earth. The heat escapes unimpeded into the freezing void of space (which rests at 2.7 Kelvin / -455°F), chilling the ground at rates exceeding 5°F to 8°F per hour after dusk.

Sand vs. Water: The Specific Heat Penalty

The ground composition of deserts accelerates this cooling cycle through thermal inertia:

  • Specific heat capacity of water: 4.18 Joules per gram per degree Celsius. Water absorbs massive amounts of heat before warming and releases that heat slowly overnight.
  • Specific heat capacity of dry quartz sand: Only 0.80 Joules per gram per degree Celsius — less than one-fifth that of water.
  • Shallow heat storage: Because dry sand is an exceptional thermal insulator, daytime heat does not penetrate deep into the subsoil. Only the top two to three inches bake in the sun. Once radiation ceases, that paper-thin surface heat dissipates within two to three hours.

Diurnal Temperature Swings Compared by Climate Zone

The table below illustrates the stark contrast between arid desert basins and humid coastal environments from official NOAA climate normals:

Reporting Station & Climate Average Dewpoint Typical Summer High Typical Summer Low Average 24h Diurnal Swing
Death Valley, CA (Arid Low Desert) 25°F (-4°C) 105°F 65°F 40°F (22°C) Swing
Tucson, AZ (Sonoran Desert) 28°F (-2°C) 92°F 54°F 38°F (21°C) Swing
Denver, CO (High Plains Steppe) 32°F (0°C) 78°F 45°F 33°F (18°C) Swing
Atlanta, GA (Humid Subtropical) 68°F (20°C) 86°F 70°F 16°F (9°C) Swing
Miami, FL (Tropical Maritime) 74°F (23°C) 88°F 77°F 11°F (6°C) Swing

To inspect 30-year diurnal temperature curves, seasonal frost risk dates, and daily normals across U.S. reporting stations, explore the interactive Eranorms climate explorer.

027 / 53

What Is a Temperature Inversion?

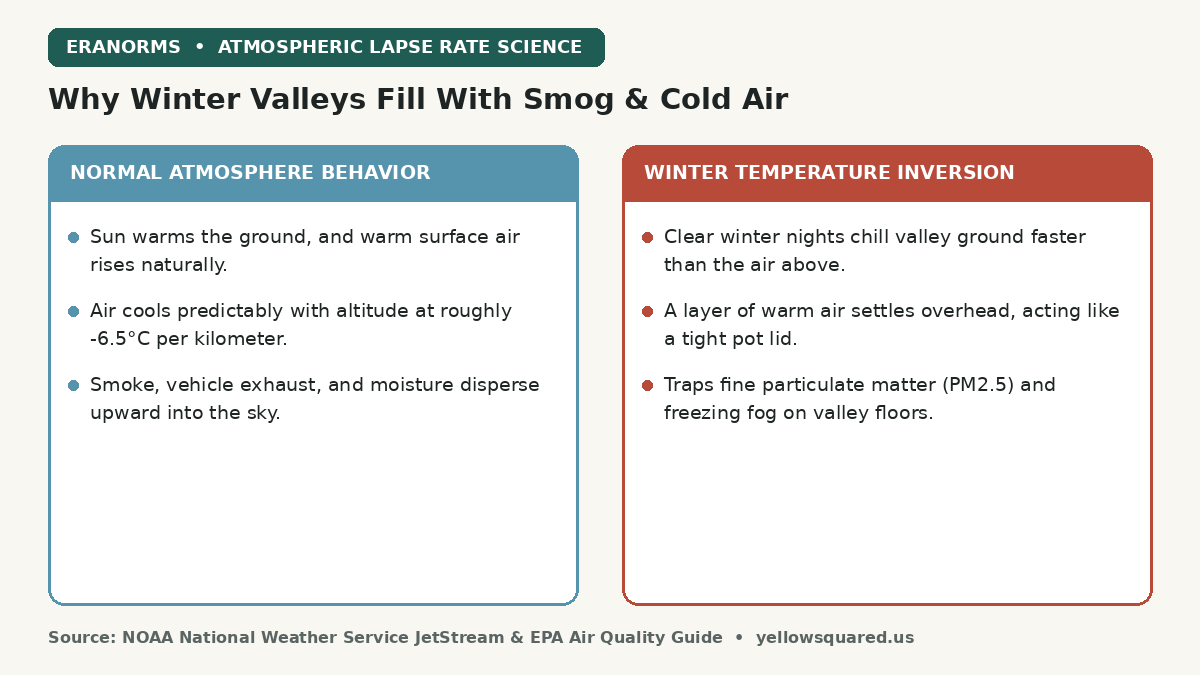
A temperature inversion is an atmospheric condition where a layer of warm air settles over colder air near the ground — completely reversing the normal tropospheric pattern where air cools with altitude. This warm overhead layer acts like an airtight lid, capping vertical convection and trapping dense valley fog, woodstove smoke, vehicle exhaust, and dangerous fine particulate pollution (PM2.5) on valley floors for days or weeks until a powerful Pacific storm or strong wind front breaks the stagnant cap.

Comparison card contrasting normal atmospheric lapse rates against winter temperature inversion dynamics.
How nocturnal radiational cooling flips atmospheric temperature profiles and traps valley air pollution under a warm lid.

Every winter, residents of mountain-ringed valleys across the American West — including the Salt Lake Valley, Boise Basin, Central Valley of California, and Puget Sound lowlands — experience the eerie contrast of temperature inversions. On the valley floor, the sky is a murky, freezing soup of gray fog and acrid smoke with air quality index (AQI) readings deep in the unhealthy red zone. Yet drive 2,000 feet up into the foothills, and you emerge into bright sunshine, azure skies, and temperatures that are 15°F warmer than in the city center.

Warm air is less dense than cold air; when a warm layer sits on top of cold valley air, natural buoyant lift stops and the atmosphere cannot breathe.

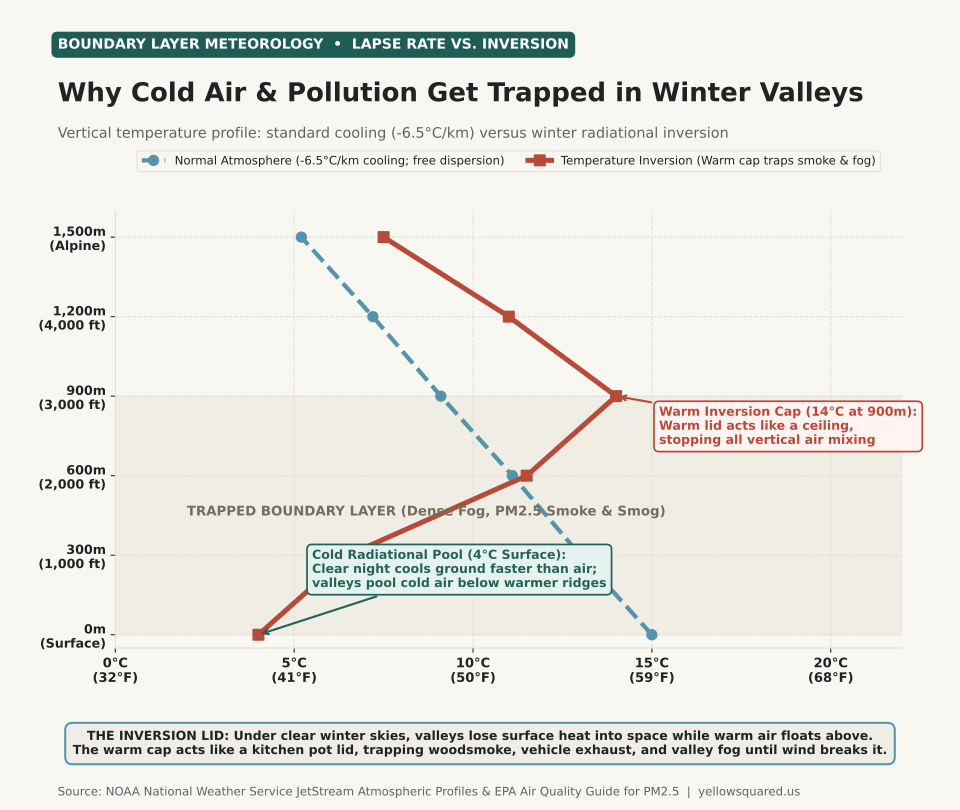
Line chart illustrating atmospheric vertical temperature profiles: normal atmosphere cooling with height from 15 degrees Celsius at surface to 5 degrees Celsius at 1500 meters, versus a winter temperature inversion starting at 4 degrees Celsius at the surface, warming to 14 degrees Celsius at 900 meters, and trapping PM2.5 smoke and fog in the boundary layer.
Figure 1: Atmospheric vertical temperature profile comparing standard environmental lapse rate cooling against a strong winter radiation inversion capping the valley boundary layer at 900 meters. Data derived from NOAA NWS JetStream Atmospheric Soundings and EPA Air Quality Meteorology. Download raw data: what-is-a-temperature-inversion-fog-pollution.csv.

How a Radiation Inversion Forms: The Physics of Winter Valleys

Under ordinary weather conditions, sunlight warms the Earth's surface during the day, which in turn warms the lowest layer of air. Because warm air is buoyant, it rises, cools at the standard environmental lapse rate of roughly -6.5°C per 1,000 meters (-3.5°F per 1,000 feet), and dilutes surface pollution throughout the deep troposphere.

During winter, two factors combine to flip this profile upside down:

  1. Nocturnal radiational cooling: High-pressure systems bring long nights (>14 hours of darkness in December and January) and clear, cloudless skies. The ground radiates thermal infrared energy into outer space much faster than the dry air above can cool.
  2. Dense cold air drainage: Cold air is heavier and denser than warm air. As air chills along mountain ridges and slopes, gravity pulls it downward into topographic basins and river valleys — a phenomenon known as katabatic drainage.
  3. Subsidence warming from above: High-pressure ridges cause air aloft to sink slowly. Sinking air compresses and warms adiabatically (roughly 5.5°F per 1,000 feet of descent). When this descending warm layer meets the pool of frozen valley air, a sharp inversion cap forms between 1,000 and 3,000 feet above the ground.

Why Air Pollution Spikes to Dangerous Levels During Inversions

According to the U.S. Environmental Protection Agency (EPA), winter inversions are responsible for the most severe non-wildfire air pollution episodes in North America. Because the vertical mixing height collapses from several thousand meters down to just 200 to 500 meters, emissions from vehicle tailpipes, industrial stacks, and residential woodstoves are confined to a tiny volume of air.

Fine particulate matter measuring 2.5 microns or less (PM2.5) cannot escape. Over three to seven days of stagnation, PM2.5 concentrations routinely climb past 55 to 150 µg/m3, penetrating deep into human lung tissue and triggering asthma and cardiovascular events. Secondary chemical reactions between ammonia from agriculture and nitrogen oxides from highway traffic create dense secondary ammonium nitrate particles, adding a milky yellow-white haze to the low-altitude radiation fog (tule fog). For how that fog differs from the sea-air kind, see advection fog vs radiation fog.

How Temperature Inversions Break

An inversion persists until one of three atmospheric forces dismantles the capping layer:

  • Frontal passage: A vigorous Pacific low-pressure storm brings strong winds (>15 to 25 mph) that mechanically churn and mix the stagnant boundary layer.
  • Solar surface heating: In late February and March, higher sun angles and longer days warm the valley floor enough to erode the inversion from the ground up.
  • Cold air advection aloft: An incoming arctic trough cools the upper atmosphere, restoring the normal lapse rate and releasing convective lift.

To examine historical daily temperature ranges and compare winter normals across reporting stations, explore the interactive Eranorms climate explorer.

028 / 53

What Is a Freeze Watch vs. Warning? Temperature & Lead Time Rules

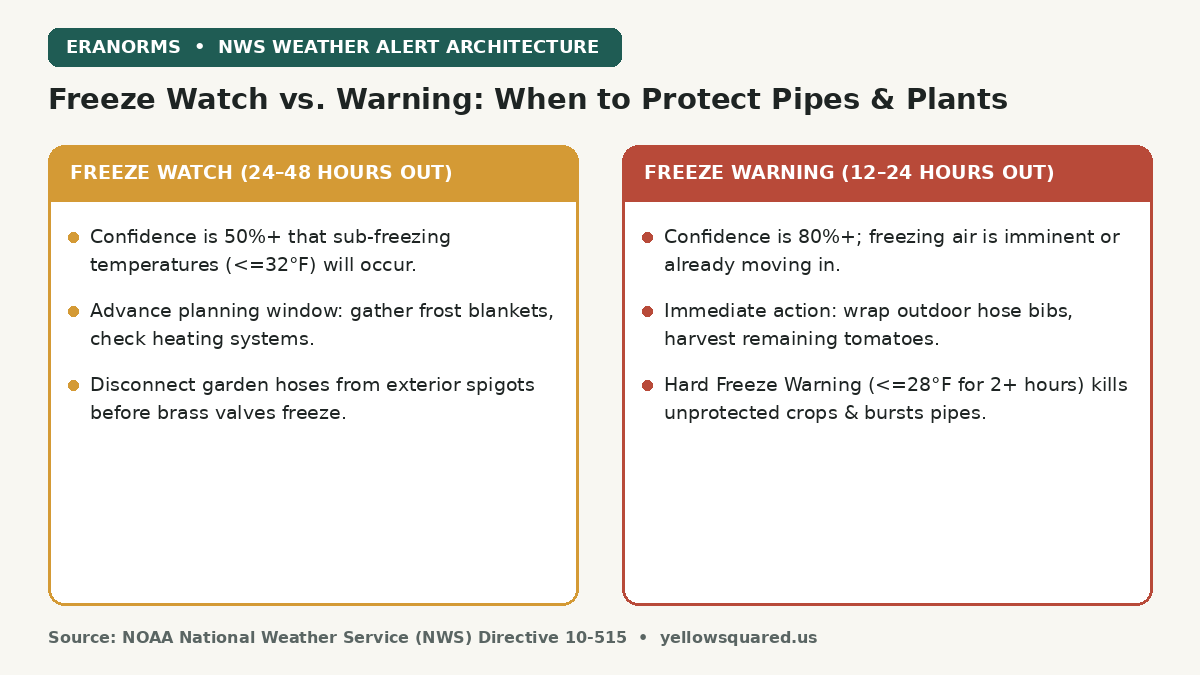
The difference between a Freeze Watch and a Freeze Warning comes down to confidence and lead time: the National Weather Service (NWS) issues a Freeze Watch 24 to 48 hours in advance when there is at least a 50 percent chance of sub-freezing temperatures (29°F to 32°F), whereas a Freeze Warning is issued 12 to 24 hours out when freezing conditions are imminent or occurring with 80 percent or greater confidence. A Frost Advisory, by contrast, applies when sheltered air temperatures drop between 33°F and 36°F on clear, calm nights because ground-level vegetation radiates heat directly into space and falls below 32°F.

Comparison card contrasting NWS Freeze Watch timing and preparation rules against Freeze Warning action steps and temperature thresholds.
NWS cold weather alert structure: why watches provide advance preparation windows while warnings trigger emergency protection.

Every autumn and early spring, gardeners, homeowners, and growers watch local forecasts anxiously as overnight lows flirt with the freezing mark. Yet confusion between watches, warnings, and advisories frequently leads to lost garden harvests or burst exterior plumbing. Knowing the exact temperature thresholds and atmospheric conditions defined by the National Weather Service ensures you take the right protective measures at the right time.

A Freeze Watch is your notification to gather frost blankets and plan; a Freeze Warning is the order to disconnect hoses, wrap spigots, and harvest tender produce.

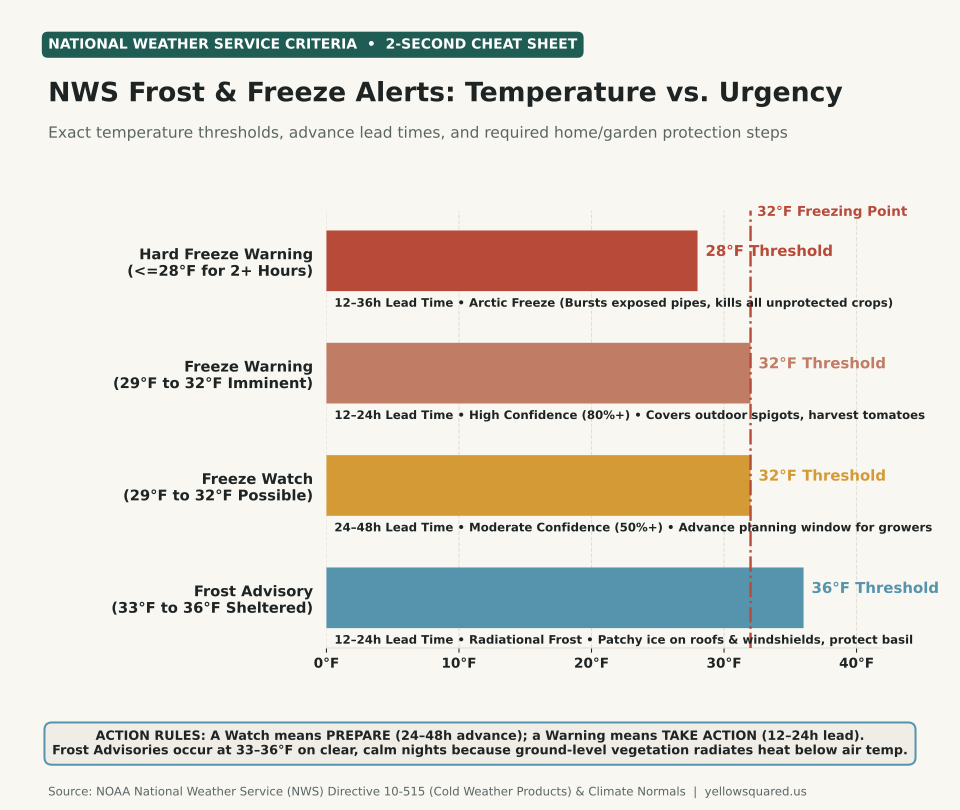
Horizontal bar chart showing National Weather Service cold alert temperature thresholds: Frost Advisory at 36 degrees, Freeze Watch and Freeze Warning at 32 degrees, and Hard Freeze Warning at 28 degrees, with the 32 degree freezing line clearly marked.
Figure 1: Official National Weather Service (NWS) temperature criteria and operational lead times across cold weather hazard products. Data compiled from NWS Directive 10-515 and NOAA regional forecast offices. Download raw data: what-is-a-freeze-watch-vs-warning.csv.

How Can Frost Form at 36°F? The Physics of Radiational Cooling

One of the most common weather questions is why an NWS office issues a Frost Advisory when the forecast low is 35°F or 36°F. Official thermometer sensors are housed inside standardized radiation shields at 5 to 6 feet above ground level (the standard 2-meter meteorological measurement height).

On clear, calm autumn nights with wind speeds under 5 mph, ground-level surfaces (grass, soil, pumpkin patches, and car windshields) radiate thermal infrared energy directly out into the cloudless night sky. In the absence of wind mixing, a shallow temperature inversion forms near the surface. The grass blades and plant leaves can cool 4°F to 7°F colder than the air 5 feet above — dropping vegetative tissue to 30°F while the official thermometer reads 36°F. Water vapor condenses and freezes directly into delicate ice crystals (hoarfrost), killing tender annuals like basil, tomatoes, and dahlias.

The 4 Official NWS Cold Alert Categories

According to NWS Directive 10-515 (Cold Weather Products), cold alerts are only issued during the locally defined growing season (between the median last spring freeze and the first autumn freeze):

Alert Product Temperature Threshold Confidence & Lead Time Required Protection Action
Frost Advisory 33°F to 36°F (Ground ≤ 32°F) 80%+ confidence (12–24h lead) Cover tender potted flowers, basil, and late garden beds with breathable cloth; move pots indoors.
Freeze Watch 29°F to 32°F (Widespread) 50%+ confidence (24–48h lead) Prepare: Locate spigot covers, inspect greenhouse heaters, and plan crop harvest.
Freeze Warning 29°F to 32°F (Imminent) 80%+ confidence (12–24h lead) Take Action: Disconnect garden hoses, shut off irrigation backflow valves, harvest all ripe tomatoes.
Hard Freeze Warning ≤ 28°F for ≥ 2 hours 80%+ confidence (12–36h lead) Emergency: Guaranteed mortality of all garden vegetation; insulate exposed pipes to prevent bursts.

Why a Hard Freeze (28°F) Is Geometrically More Destructive

Water expands by 9 percent as it transitions from liquid to ice. When temperatures hover between 29°F and 32°F for an hour or two, only thin exterior cell walls or outer leaves freeze, while soil warmth and latent heat keep root systems and sheltered stems viable. Once ambient temperatures stay at or below 28°F for two consecutive hours, cold penetrates deep into plant crowns, perennial roots, and brass plumbing fixtures. Water inside uninsulated outdoor pipes freezes solid, generating hydrostatic pressures exceeding 2,000 pounds per square inch and rupturing copper or PVC joints.

To inspect 30-year autumn frost dates and daily minimum temperature probabilities across U.S. reporting stations, explore the Eranorms climate explorer.

029 / 53

What is a Derecho Wind Storm? How It Differs From a Tornado

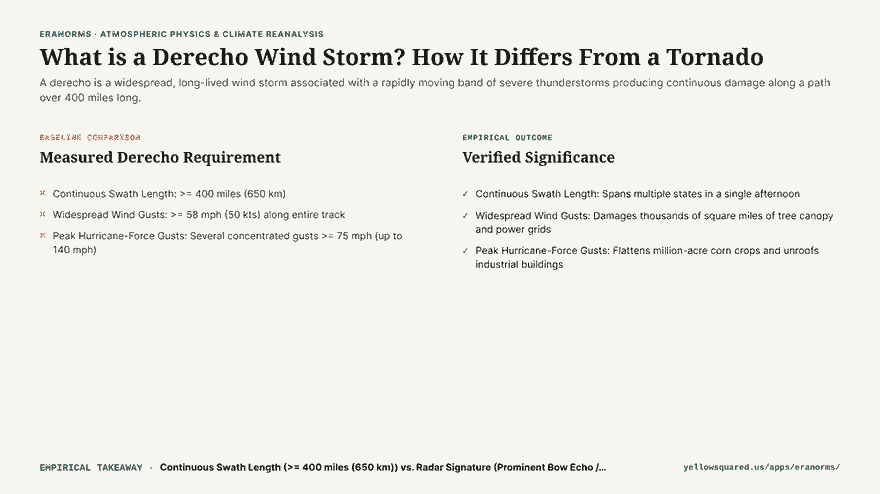
A derecho is not an ordinary thunderstorm or a tornado: it is a widespread, long-lived convective windstorm that carves a continuous path of severe straight-line wind damage spanning at least 400 miles. Often referred to by meteorologists as an “inland hurricane,” a derecho produces sustained winds exceeding 58 mph with localized bursts topping 100 to 140 mph, capable of flattening millions of acres of crops and knocking out metropolitan power grids for weeks.

Hook card contrasting localized tornado vortex damage against 400-mile continuous derecho straight-line wind destruction.
Convective storm classification: localized tornadic rotation versus continuous derecho straight-line wind swaths.

The term “derecho” was first coined in 1888 by Dr. Gustavus Hinrichs, a physics professor at the University of Iowa, who noted that unlike circular tornadoes (from the Spanish tornar, meaning to turn), these damaging storms moved straight ahead (from the Spanish derecho, meaning straight). Today, the NOAA Storm Prediction Center (SPC) enforces strict scientific criteria to distinguish official derechos from ordinary squall lines.

Tornadoes damage neighborhood blocks in spirals; derechos level entire states with straight-line wall-of-wind acceleration.

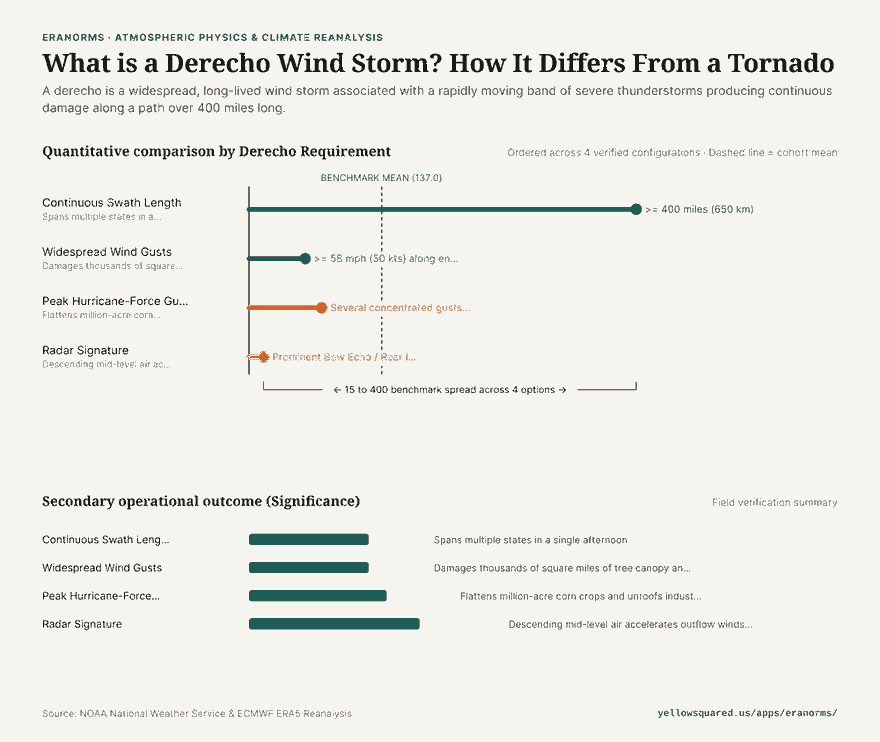
Horizontal bar chart illustrating NOAA Storm Prediction Center criteria for an official derecho including 400+ mile swath length, 58+ mph wind floor, and 75-140 mph peak hurricane-force gusts.
Figure 1: NOAA SPC criteria defining a derecho event. Data verified from NOAA Storm Prediction Center and published meteorological literature (Corfidi et al., 2016). Download raw metrics: what-is-a-derecho-wind-storm.csv.

The Official NOAA SPC Criteria for a Derecho

To be categorized as a derecho by NOAA meteorologists, a convective storm system must satisfy four non-negotiable thresholds:

  1. Continuous Swath Length (>= 400 Miles / 650 km): The storm complex must generate a concentrated path of damaging wind reports spanning at least 400 miles along its major axis.
  2. Severe Wind Floor (>= 58 mph / 50 kts): Severe wind gusts must occur along virtually the entire length of the damage track rather than occurring as an isolated burst.
  3. Hurricane-Force Peaks (>= 75 mph / 65 kts): The storm must produce multiple, well-separated occurrences of significant severe wind gusts exceeding 75 mph. During the historic August 10, 2020 Midwest Derecho, wind gusts reached an astonishing 140 mph in Cedar Rapids, Iowa.
  4. Rapid Forward Speed (50 to 70 mph): The bow echo complex races across the landscape at highway speeds, giving residents downstream minimal advance warning.

The Physics of the Bow Echo: Why the Winds Accelerate

On radar imagery, derechos appear as distinctive curved lines shaped like an archer’s bow, known as a bow echo. This bow structure is driven by an atmospheric engine known as the Rear Inflow Jet (RIJ).

As rain and hail evaporate in the mid-troposphere behind the leading convective line, intense evaporative cooling makes the air exceptionally dense. This cold air plunges toward the ground and pulls fast mid-level jet stream momentum downward with it. When this high-velocity downdraft slams into the earth, it has nowhere to go but forward, creating devastating straight-line winds that push the center of the storm line outward into a bow.

Derecho vs. Tornado: Key Differences

Characteristic Derecho Tornado
Wind Direction Straight-line (all trees fall in the same direction) Rotational (debris scattered in spiral patterns)
Damage Footprint 400 to 1,000+ miles long; 50 to 100 miles wide Typically 1 to 20 miles long; 50 to 500 yards wide
Duration 6 to 18 hours across multiple states Few minutes to 1 hour
Radar Feature Broad bow echo with Rear Inflow Jet Hook echo and Velocity Couplet / TVS

How to Prepare for a Severe Convective Wind Event

  • Treat severe thunderstorm warnings with tornado urgency: When the National Weather Service mentions a “destructive derecho” or “winds in excess of 80 mph,” move immediately to an interior room on the lowest floor.
  • Clear outdoor hazards: High-speed straight-line winds turn patio furniture and trampolines into dangerous projectiles.
  • Explore historical climate and severe storm data: Review historical convective weather patterns and storm metrics at Eranorms.

030 / 53

Why Do Leaves Change Color at Different Times Each Fall?

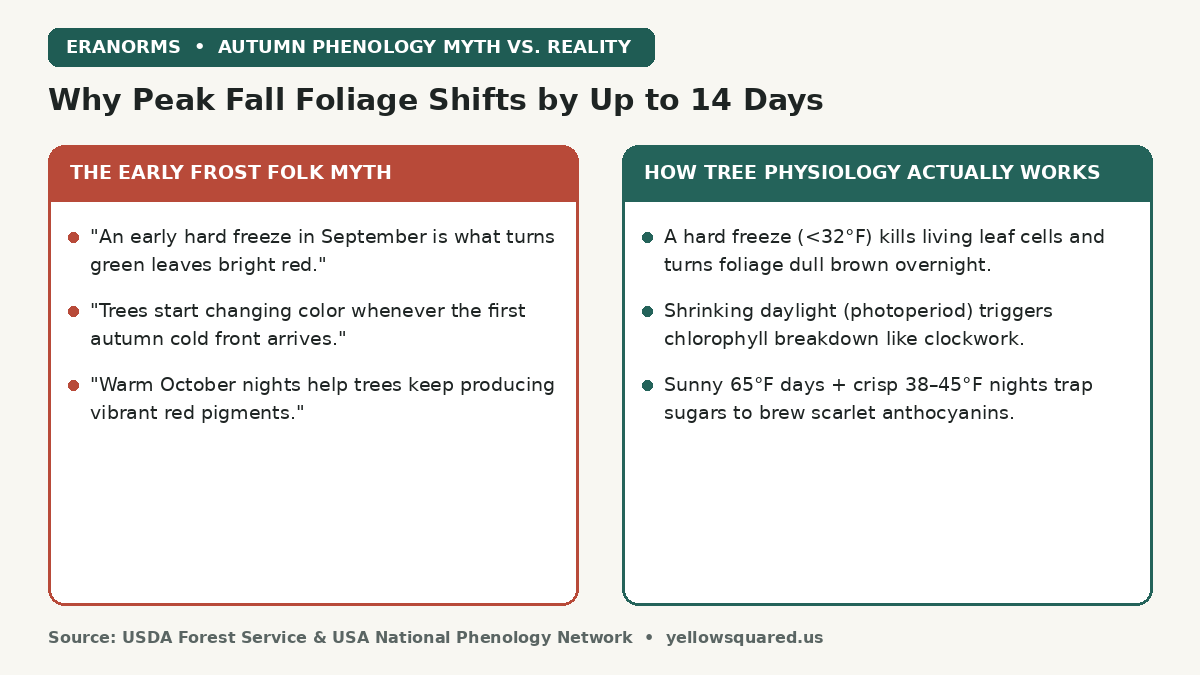
Autumn leaves change color on a two-stage biological system: shrinking daylight hours (photoperiod) set the strict calendar start date for green chlorophyll breakdown, while October weather — specifically sunny 65°F afternoons paired with crisp 38°F to 45°F nights — controls how much scarlet red pigment a tree manufactures before leaf drop. Contrary to popular folklore, an early hard frost (<32°F) does not create bright fall colors; freezing ruptures living leaf cells and turns foliage dull brown overnight.

Comparison card contrasting the early frost folk myth of fall foliage with USDA Forest Service tree physiology showing that shrinking daylight triggers chlorophyll loss while sunny days and 38 to 45 degree nights brew red anthocyanins.
Why an early freeze ruins fall color rather than creating it — and how photoperiod and October temperature swings divide the workload.

Every September and October, travelers planning autumn foliage trips notice a puzzling pattern: the exact same sugar maple or red oak ridge can blaze neon scarlet on October 12 one year, peak ten days later the next year, or fade straight from muted yellow to brown the year after. Understanding the three chemical pigment classes inside a deciduous leaf explains why astronomy governs the schedule while local weather governs the spectacle.

Yellow and gold pigments wait inside the leaf all summer long; scarlet and crimson pigments must be freshly brewed in October from trapped afternoon sugars.

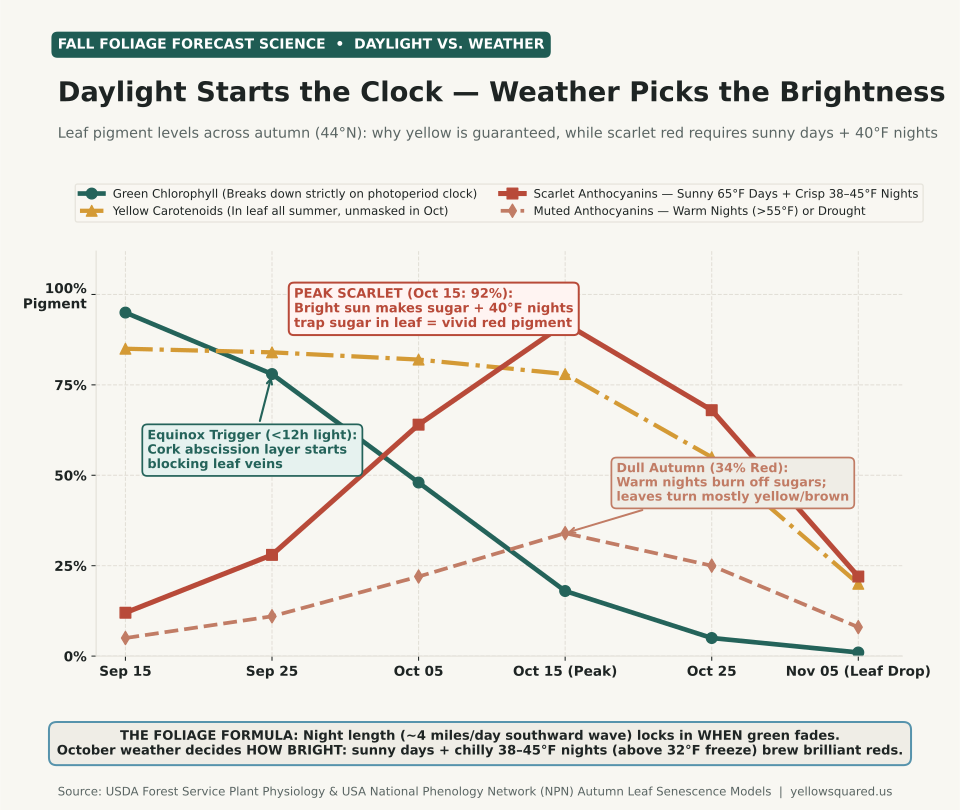
Line chart tracking relative leaf pigment levels across autumn at 44 degrees North from September 15 to November 5: green chlorophyll drops steadily from 95 percent to 1 percent, yellow carotenoids stay high at 85 to 78 percent until late October, scarlet anthocyanins surge to 92 percent on October 15 under sunny days and 40 degree nights, and muted anthocyanins peak at only 34 percent under cloudy warm nights.
Figure 1: Seasonal trajectory of leaf pigment classes at 44°N latitude (Northern New England / Upper Midwest / Pacific Northwest cascades), comparing anthocyanin synthesis under sunny/crisp weather versus cloudy/warm-night autumn anomalies. Synthesized from USDA Forest Service Plant Physiology and USA National Phenology Network (NPN) models. Download raw data: why-do-leaves-change-color-at-different-times.csv.

The Three Pigment Classes Inside Deciduous Leaves

According to plant physiologists at the U.S. Forest Service, autumn foliage color comes from the interplay of three distinct chemical families:

  1. Chlorophyll (Green): The photosynthetic powerhouse that absorbs red and blue wavelengths of sunlight to convert carbon dioxide and water into glucose. Because chlorophyll is unstable in bright light, trees must continuously synthesize it all summer.
  2. Carotenoids — Lutein, Beta-Carotene, and Xanthophylls (Yellow & Orange): These stable accessory pigments sit inside the leaf plastids all summer alongside chlorophyll (the exact same compounds that color corn, carrots, and Birch or Aspen leaves). Because carotenoids degrade much more slowly than chlorophyll, they are unmasked every autumn regardless of October weather — which is why yellow birch, hickory, ginkgo, and quaking aspen reliably turn gold every single year.
  3. Anthocyanins (Scarlet, Crimson & Purple): Unlike yellow carotenoids, water-soluble anthocyanins are not present in summer leaves. Trees such as red maple, sugar maple, scarlet oak, sourwood, and dogwood synthesize anthocyanins inside cell vacuoles during autumn only when high concentrations of simple sugars become trapped inside the leaf blade under bright sunlight.

Why Sunny Days + 40°F Nights Brew the Brightest Reds

Once night length passes the critical threshold around the September equinox, phytochrome photoreceptors instruct the tree to grow a corky abscission layer across the base of each leaf stem (petiole). Crucially, the incoming water pipes (xylem) stay open slightly longer than the outgoing sugar pipes (phloem).

During a bright, sunny October afternoon (~60°F to 68°F), the remaining chlorophyll still manufactures a surge of glucose. When the sun sets and temperatures drop swiftly into the crisp 38°F to 45°F range (chilly, but safely above the 32°F freezing point), metabolic respiration slows down and phloem transport out of the leaf stalls. Trapped inside the leaf cells, those sugars react with sap proteins in the presence of sunlight to produce brilliant red anthocyanin pigments — which act as a natural botanical sunscreen, shielding the leaf's nutrient-recovery machinery while the tree resorbs up to 50 percent of its leaf nitrogen and phosphorus back into its branches before winter.

How Weather Anomalies Shift Peak Timing and Color Intensity

While the southward wave of lengthening nights marches from northern latitudes (~48°N) toward southern mountains (~35°N) at roughly 4 miles per day, multi-decade observations tracked by the USA National Phenology Network show how temperature and rainfall anomalies shift peak foliage by 7 to 14 days relative to 30-year climate normals:

Autumn Weather Pattern Effect on Peak Timing Effect on Red / Orange Intensity Biological Mechanism
Sunny 65°F Days + Crisp 38–45°F Nights On-schedule peak 90–100% Peak Scarlet High daytime sugar production + cold-slowed nighttime phloem export maximizes anthocyanin synthesis.
Warm Autumn Nights (>55°F in Oct) Delayed 5 to 12 days Muted (30–40% Red) Trees respire away daytime sugars overnight; leaves stay green longer, then turn mostly yellow/bronze.
Early Hard Freeze (<28–32°F in Sep/Early Oct) Abrupt early termination Ruined (Brown / Brittle) Ice crystals rupture living parenchyma cells before chlorophyll breakdown or sugar trapping can finish.
Late-Summer Severe Drought 1 to 2 weeks early Dull / Premature Drop Water stress triggers early abscisic acid (ABA) hormone release; trees seal petioles and shed leaves early.
Gale-Force Autumn Rainstorm Shortens peak window Moderate (pre-storm) Heavy rain saturates blades while wind shears weakened cork abscission layers, stripping crowns in 24h.

How to Check Local Temperature Normals Before Booking a Foliage Trip

Because elevation acts just like latitude — cooling roughly 3.5°F per 1,000 feet of altitude — a 3,500-foot ridge in the Blue Ridge or Cascades hits the 40°F nighttime sweet spot two to three weeks before the adjacent valley floor. You can compare historical autumn high/low temperature curves and monthly rainfall normals across U.S. stations by exploring the Eranorms climate explorer.

031 / 53

Why Does the Sun Set So Early in November? Daylight Saving and the 5 PM Cliff

The sun sets so early in November because a sudden 60-minute Daylight Saving Time clock shift stacks on top of the year's steepest natural daylight loss - dropping local sunsets from nearly 6:00 PM to before 5:00 PM overnight. However, if you dread dark winter afternoons, astronomy offers an unexpected silver lining: the earliest sunset of the year actually arrives around December 8 to December 12 at mid-latitudes, nearly two full weeks before the December 21 winter solstice.

Every autumn, millions of commuters experience the same disorienting shock during the first week of November. In late October, you can still leave work or school with golden twilight on the horizon. Seven days later, it is pitch dark before 5:00 PM. Understanding how human clock rules interact with Earth's axial tilt and elliptical orbit explains both why November feels like a cliff and why your evenings start brightening much earlier in December than most people realize.

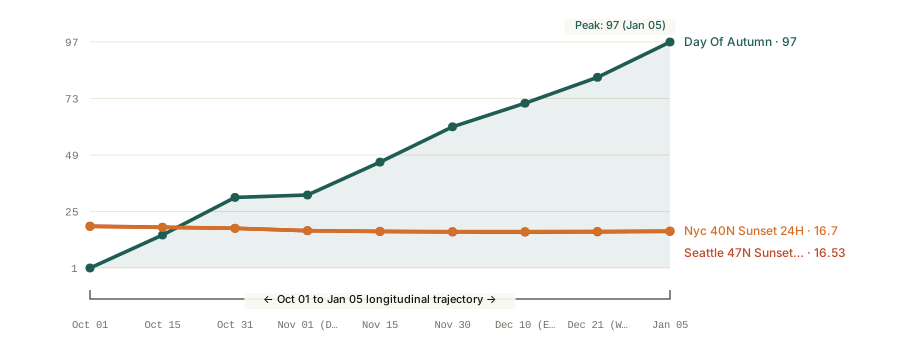
Line chart of local sunset times from October 1 to January 5 for Seattle (47.6 degrees North) and New York City (40.7 degrees North), illustrating the 60-minute Daylight Saving Time cliff on November 1 and the earliest sunset around December 10 prior to the December 21 winter solstice.
Figure 1: Local clock sunset trajectory from October 1 through January 5 at 47.6°N (Seattle) and 40.7°N (New York City), showing the November 1 Daylight Saving Time fallback across the 5:00 PM threshold and the early-December sunset minimum. Data computed from the NOAA Global Monitoring Laboratory Solar Calculator and US Naval Observatory (USNO) tables. Download raw data: why-does-the-sun-set-so-early-november.csv.

Part 1: How Daylight Saving Time Hides October's Orbital Loss - Then Drops the Bill All at Once

Earth's rotational axis is tilted by 23.44 degrees relative to its orbital plane around the Sun. Between the September autumnal equinox (around September 22) and late November, the Northern Hemisphere tilts rapidly away from direct solar radiation. In fact, solar declination changes fastest near the equinoxes and slows down as it approaches the solstices - a seasonal geometry that also drives how 30-year climate normals step down through autumn.

Throughout October, mid-latitude cities (40°N to 48°N) lose roughly 1.5 to 2.2 minutes of evening sunset time every single day, adding up to 45 to 56 minutes of lost evening light across the month. Because clocks are still set to Daylight Saving Time (UTC-4 on the East Coast, UTC-7 on the West Coast), that gradual erosion stays above the psychological 6:00 PM mark for most of the month.

Then, on the first Sunday in November under the U.S. Energy Policy Act schedule maintained by the U.S. Department of Transportation, clocks shift back 60 minutes to Standard Time at 2:00 AM. That single administrative step shifts an hour of evening daylight into the morning, combining with October's orbital loss to pull sunset from roughly 6:45 PM on October 1 down to 4:50 PM on November 1 - a cumulative nearly two-hour evening drop in just 32 days.

Part 2: Why the Earliest Sunset Happens Around December 10 - Two Weeks Before the Winter Solstice

Most people assume that since the winter solstice (December 21) is the shortest day of the year, it must also have the earliest sunset and the latest sunrise. In reality, those three milestones fall on three different dates nearly a month apart:

  • Earliest sunset of the year: Around December 8 to December 12 (for cities between 35°N and 48°N).
  • Shortest total daylight (Winter Solstice): December 21 (when the Northern Hemisphere reaches its maximum 23.44-degree tilt away from the Sun).
  • Latest sunrise of the year: Around January 2 to January 6.

Why do sunsets start getting later in mid-December while total daylight is still shrinking? The answer is the Equation of Time - the discrepancy between a uniform 24-hour mechanical clock and true solar time, documented by the U.S. Naval Observatory.

Two orbital facts combine in December: first, Earth travels in an elliptical orbit and reaches perihelion (its closest approach to the Sun, where orbital velocity is fastest under Kepler's second law) in early January; second, the Sun's apparent path is tilted steeply at the solstice. Together, these cause true solar noon (the exact moment the Sun crosses your local meridian at its highest point) to drift roughly 30 seconds later on the wristwatch every single day between late November and late December.

By December 10, the rate at which the whole solar day is sliding forward on the clock (+30 seconds per day) overtakes the slowing rate at which total daylight is shrinking (<25 seconds per day at the evening end). As a result, clock sunsets bottom out around December 10 and begin creeping later every afternoon, while mornings continue getting darker until early January.

Autumn and Early-Winter Sunset Milestones by Latitude

The table below compares exact clock sunset milestones for a northern-tier U.S. city (Seattle, 47.6°N) and a mid-latitude city (New York City, 40.7°N):

Calendar Date Clock Regime Seattle (47.6°N) Sunset New York (40.7°N) Sunset Seasonal Milestone
October 1 Daylight Saving (PDT/EDT) 6:48 PM 6:38 PM Steepest daily orbital sunset loss (~2 min/day)
October 31 Daylight Saving (PDT/EDT) 5:52 PM 5:51 PM Final evening before Standard Time fallback
November 1 Standard Time (PST/EST) 4:50 PM 4:50 PM The 5 PM Cliff: 60-minute overnight drop
November 30 Standard Time (PST/EST) 4:18 PM 4:29 PM Orbital loss slows to <45 seconds per day
December 10 Standard Time (PST/EST) 4:16 PM (Earliest) 4:28 PM (Earliest) Earliest Sunset: Solar noon shift overtakes tilt
December 21 Standard Time (PST/EST) 4:20 PM 4:32 PM Winter Solstice: Shortest total day, 4 min brighter evening
January 5 Standard Time (PST/EST) 4:32 PM 4:42 PM Latest sunrise occurs; evenings +14 to +16 min brighter

How to Use Early-December Astronomy to Plan Your Winter Routine

Knowing that the evening darkness floor arrives around December 10 - not late December or January - makes it much easier to pace your autumn routine. Once you get past the four-week stretch between November 1 and December 10, every single afternoon gives back evening light. To compare how seasonal daylight interacts with local temperature norms and winter cold snaps across U.S. stations, check our analysis of winter temperature lows at six U.S. airports or look up your city's daily historical normals inside the Eranorms climate explorer.

032 / 53

Why Does It Hail in the Summer? The Physics of Warm-Season Ice

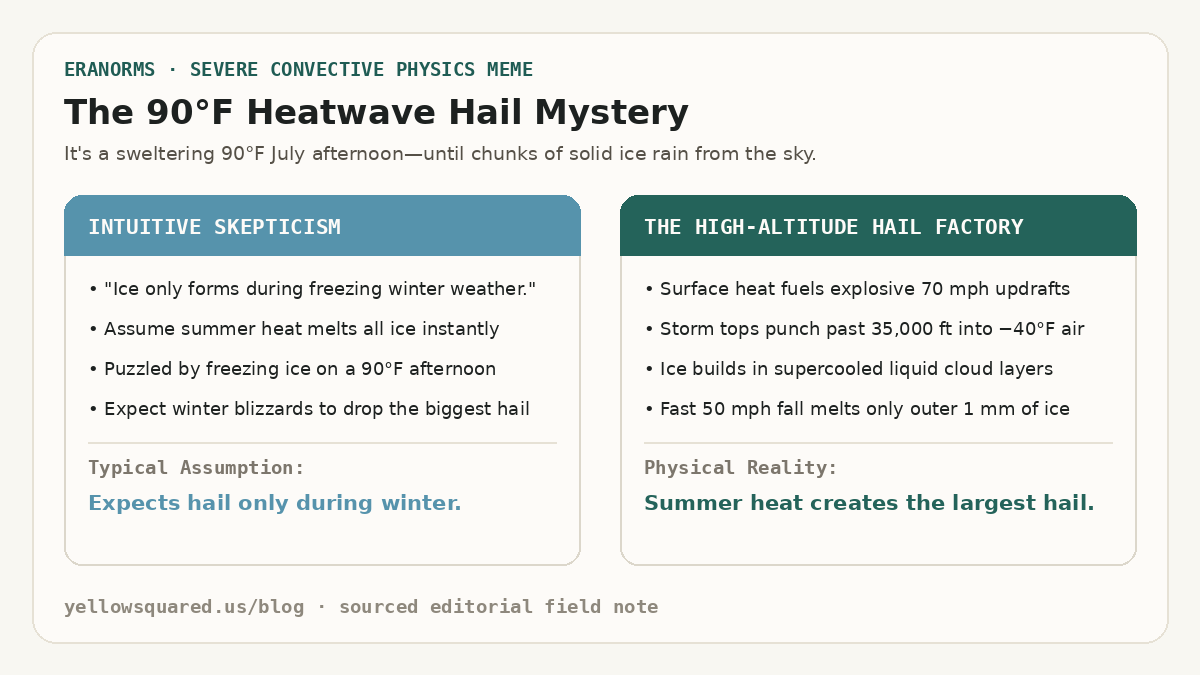
The 90-Degree Heatwave Hail Mystery: Contrasting the intuitive assumption that ice only forms in winter against the convective physics where summer heat creates 70-mph updrafts and minus-40-degree cloud tops.
The summer hail paradox: intense ground heating drives the explosive vertical updrafts necessary to push thunderstorm clouds into subzero air, allowing severe hailstones to form on days when surface temperatures exceed 90°F.

When a sudden summer thunderstorm rolls across a sunbaked city, people expect heavy rain, gusty winds, and lightning. But when golf-ball-sized chunks of solid ice bounce off cars on an 88°F (31°C) July afternoon, it feels like a violation of the laws of physics. Why does the largest, most damaging hail happen at the peak of summer heat rather than during sub-freezing winter blizzards? According to convective sounding records from the NOAA National Severe Storms Laboratory (NSSL), the answer lies in an atmospheric paradox: summer heat is the exact engine required to build hail.

Hail cannot form in ordinary rainclouds or gentle winter snow showers. It requires immense convective instability - fueled by sweltering surface temperatures and high humidity - to launch violent thunderstorm updrafts exceeding 50 to 80 miles per hour. These updrafts shoot moisture thirty to fifty thousand feet into the troposphere, where temperatures plunge to −40°F (−40°C) even on the hottest summer days.

Winter blizzards produce snowflakes and soft sleet; it takes the explosive energy of a ninety-degree summer heatwave to create the vertical jet engine that manufactures true hailstones.

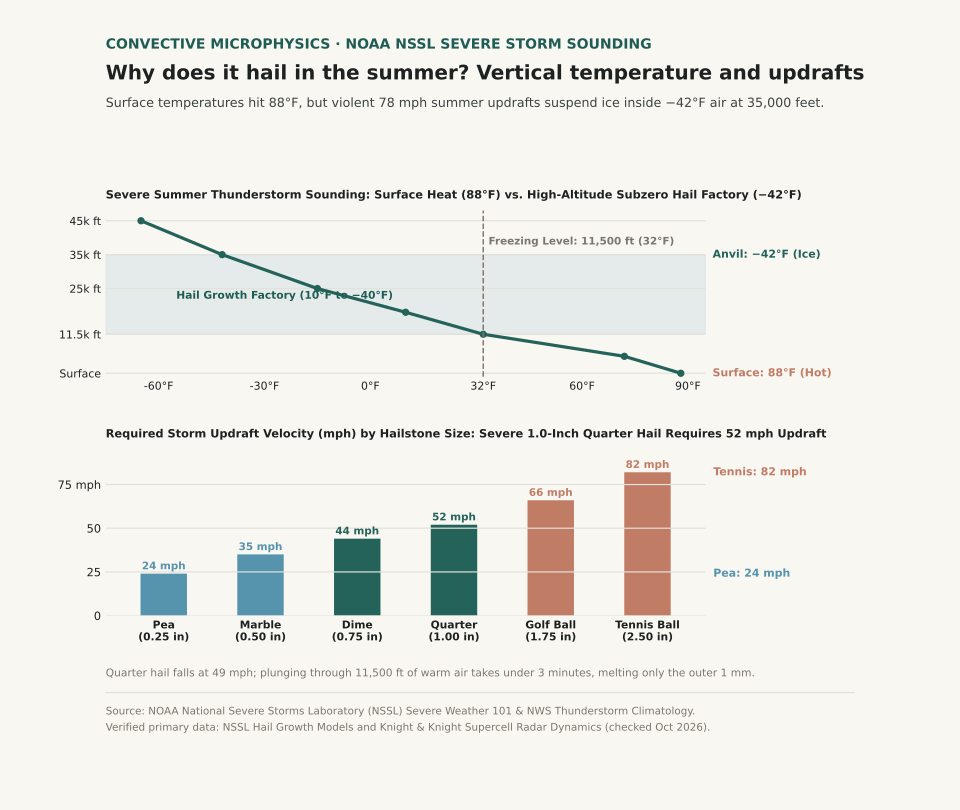
Two-panel scientific chart showing a vertical thunderstorm sounding with surface heat alongside required updraft velocities by hailstone size.
Panel A illustrates a severe summer thunderstorm sounding: while ground temperatures reach 88°F, the freezing level sits at 11,500 ft, and cloud tops reach −42°F at 35,000 ft inside the hail growth factory. Panel B plots the storm updraft velocity required to suspend hailstones: a severe 1.0-inch quarter hailstone demands a 52 mph updraft. Reproducible dataset: summer-hail-thunderstorm-structure.csv.

How Summer Heat Acts as an Updraft Engine

To create hail, an air parcel must rise violently. On a hot summer afternoon, intense solar radiation heats the ground, which in turn superheats the boundary layer of air directly above it. Because warm air is less dense than cold air, it becomes buoyant. When a passing weather front or mountain breeze triggers this unstable air, it rockets upward like a hot-air balloon.

Meteorologists measure this energy as Convective Available Potential Energy (CAPE). In typical winter storms, CAPE rarely exceeds 200 Joules per kilogram. In severe summer supercells, CAPE routinely surpasses 2,500 to 4,000 J/kg, generating updraft speeds between 50 and 90 miles per hour (22 to 40 meters per second). Without that summer heat engine, storm clouds cannot support the weight of growing ice.

Inside the Cloud: The Freezing Level and the Hail Factory

While the ground swelters at 88°F, the atmosphere cools rapidly with height at the environmental lapse rate. In summer, the freezing level (0°C / 32°F isotherm) typically sits between 11,000 and 14,000 feet above ground level. Above that boundary lies a deep column of sub-freezing air where moisture exists as supercooled liquid water droplets - water that remains liquid down to −40°F because it lacks a mineral nucleus to freeze upon.

When a tiny ice crystal or frozen raindrop embryo enters this zone, supercooled droplets freeze onto it on contact. As the thunderstorm's powerful updraft repeatedly suspends the embryo in this high-altitude "hail factory" (between 10°F and −40°F), the stone collects layer after layer of ice:

  • Wet Growth: In warmer, moisture-dense cloud zones near freezing, water coats the stone and freezes slowly into clear, high-density ice rings.
  • Dry Growth: In colder upper regions (−15°F to −40°F), droplets freeze instantly on impact, trapping microscopic air bubbles that form cloudy white rime rings.

A hailstone's concentric rings are not formed by bouncing up and down dozens of times; they form as the stone passes through varying liquid water concentrations within a single massive updraft plume.

Why Hail Doesn't Melt on the Way Down to Earth

If the ground is 88°F and the freezing level is 11,500 feet up, why doesn't the hailstone melt into ordinary rain before reaching the ground? The answer is terminal velocity and thermal mass.

Hailstone sizes, required updraft speeds, fall velocity, and descent times through the warm layer (sources: NOAA NSSL Severe Weather 101 and NWS Hail Climatology).
Hail Description Diameter (in / mm) Required Updraft Speed Terminal Fall Velocity Fall Time Through Warm Layer (11,500 ft) Melting Loss During Fall
Pea Size 0.25 in (6.4 mm) 24 mph (10.7 m/s) 18 mph (8.0 m/s) ~7.2 minutes 70% to 100% melts into cold rain
Marble Size 0.50 in (12.7 mm) 35 mph (15.6 m/s) 28 mph (12.5 m/s) ~4.6 minutes 40% to 50% melts into slush
Quarter (Severe Criteria) 1.00 in (25.4 mm) 52 mph (23.2 m/s) 49 mph (21.9 m/s) ~2.6 minutes Only outer 1–2 mm melts (~15% mass)
Golf Ball 1.75 in (44.5 mm) 66 mph (29.5 m/s) 62 mph (27.7 m/s) ~2.1 minutes <10% melts; strikes ground with destructive force
Tennis Ball 2.50 in (63.5 mm) 82 mph (36.6 m/s) 75 mph (33.5 m/s) ~1.7 minutes <5% melts; shatters windshields and roof tiles

A one-inch quarter hailstone falls at nearly 50 miles per hour. Plunging through 11,500 feet of warm air takes just over two and a half minutes. That is far too brief for heat to conduct into the core of dense, solid ice (0.90 g/cm³); only a millimeter or two of the outer shell melts into water. Furthermore, as the stone falls through drier air under the cloud base, evaporative cooling chills the air immediately surrounding the stone, creating a protective sub-freezing envelope during descent.

Curious how summer thunderstorm frequencies and temperature departures compare across decades in your city? Open Eranorms in your browser or Download Eranorms for iPhone and Get Eranorms on Android to explore historical convective weather records, climate normals, and seasonal trends across thousands of weather stations.